Know what your application is processing right now.
See active transactions and identify requests that are taking unusually long.
Active Service Status
Concept illustration · 26 seconds · SilentActual product recording · Controlled demo trafficJENNIFER APM
Monitor running transactions in real time, identify slow ones, and see where time is spent.
WHY JENNIFER
Modern systems generate logs, metrics, traces, and infrastructure data. They all provide useful context. When a user experiences a slow or failed request, the problem shows up in an application transaction. JENNIFER starts there.
THE JENNIFER SIGNATURE EXPERIENCE
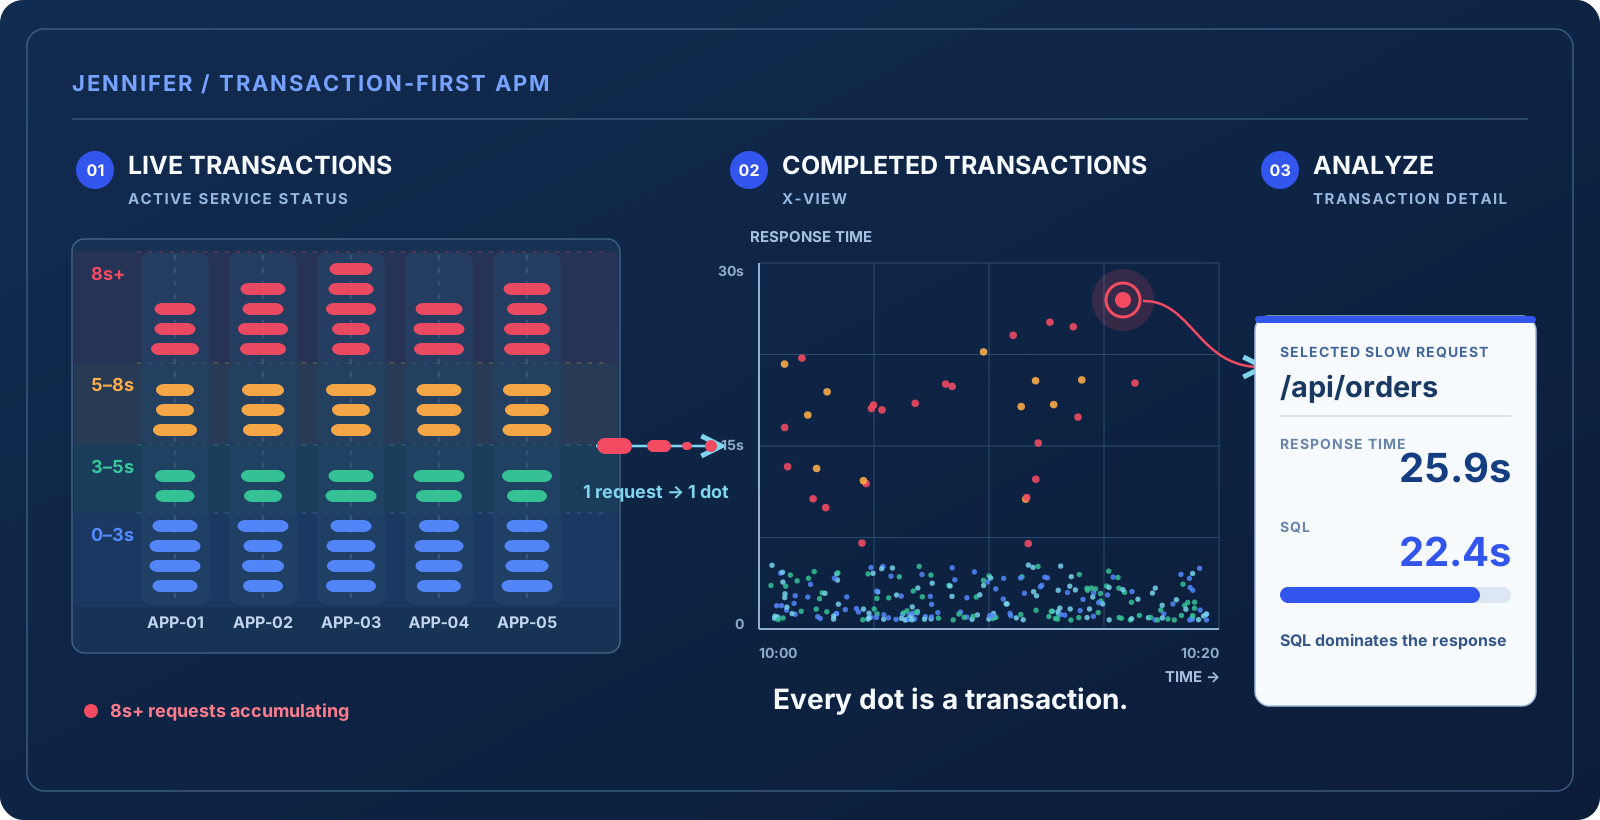
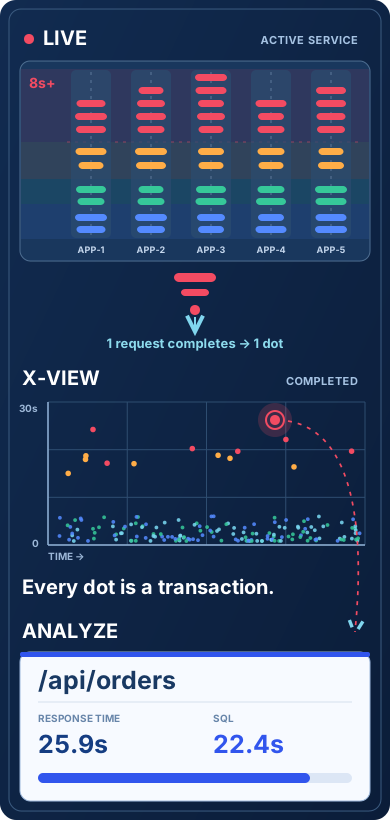
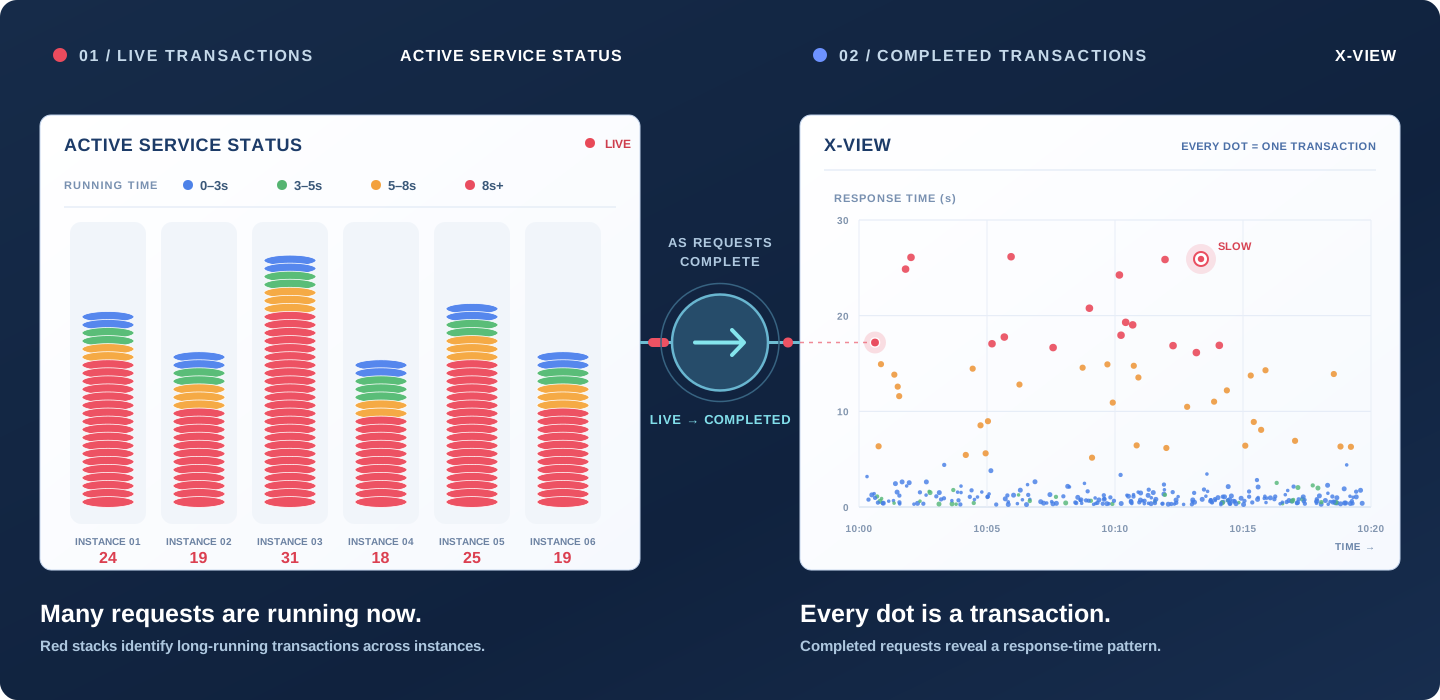
Many live transactions become a response-time pattern. Choose the request that needs attention, then examine where its time was spent.
 LIVE TRANSACTIONS ACTIVE SERVICE
1 request completes ↓ 1 dot
COMPLETED TRANSACTIONS X-VIEW
Every dot is a transaction.
LIVE TRANSACTIONS ACTIVE SERVICE
1 request completes ↓ 1 dot
COMPLETED TRANSACTIONS X-VIEW
Every dot is a transaction.
In the /api/orders example, SQL accounts for most of the response time.
Response time 25.9s
The visual simplifies JENNIFER's Active Service Status and X-View behavior. The analysis values come from the captured /api/orders example. Actual product screens are shown below.
ACTUAL PRODUCT SCREENS
Explore the original product captures behind the simplified transaction lifecycle above.
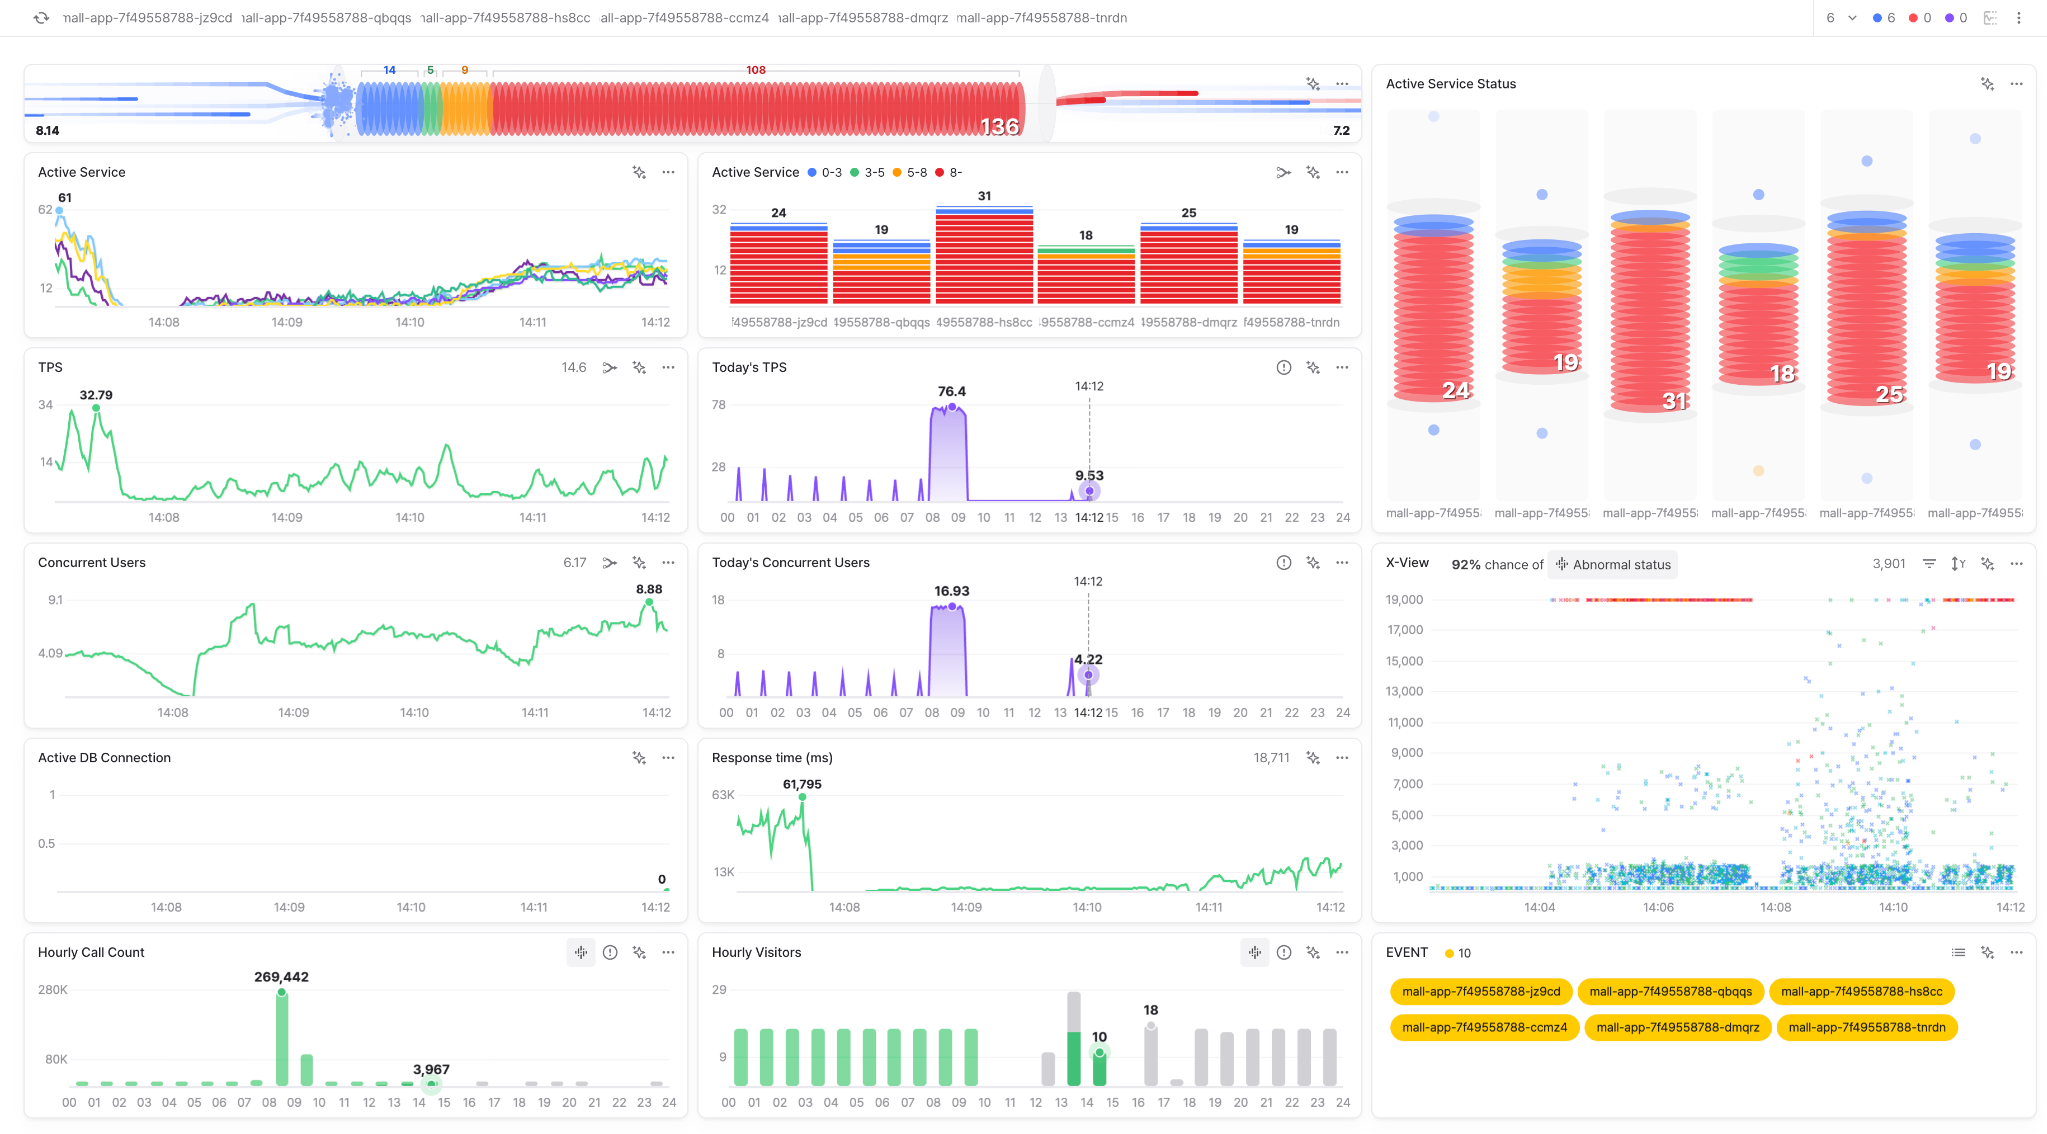
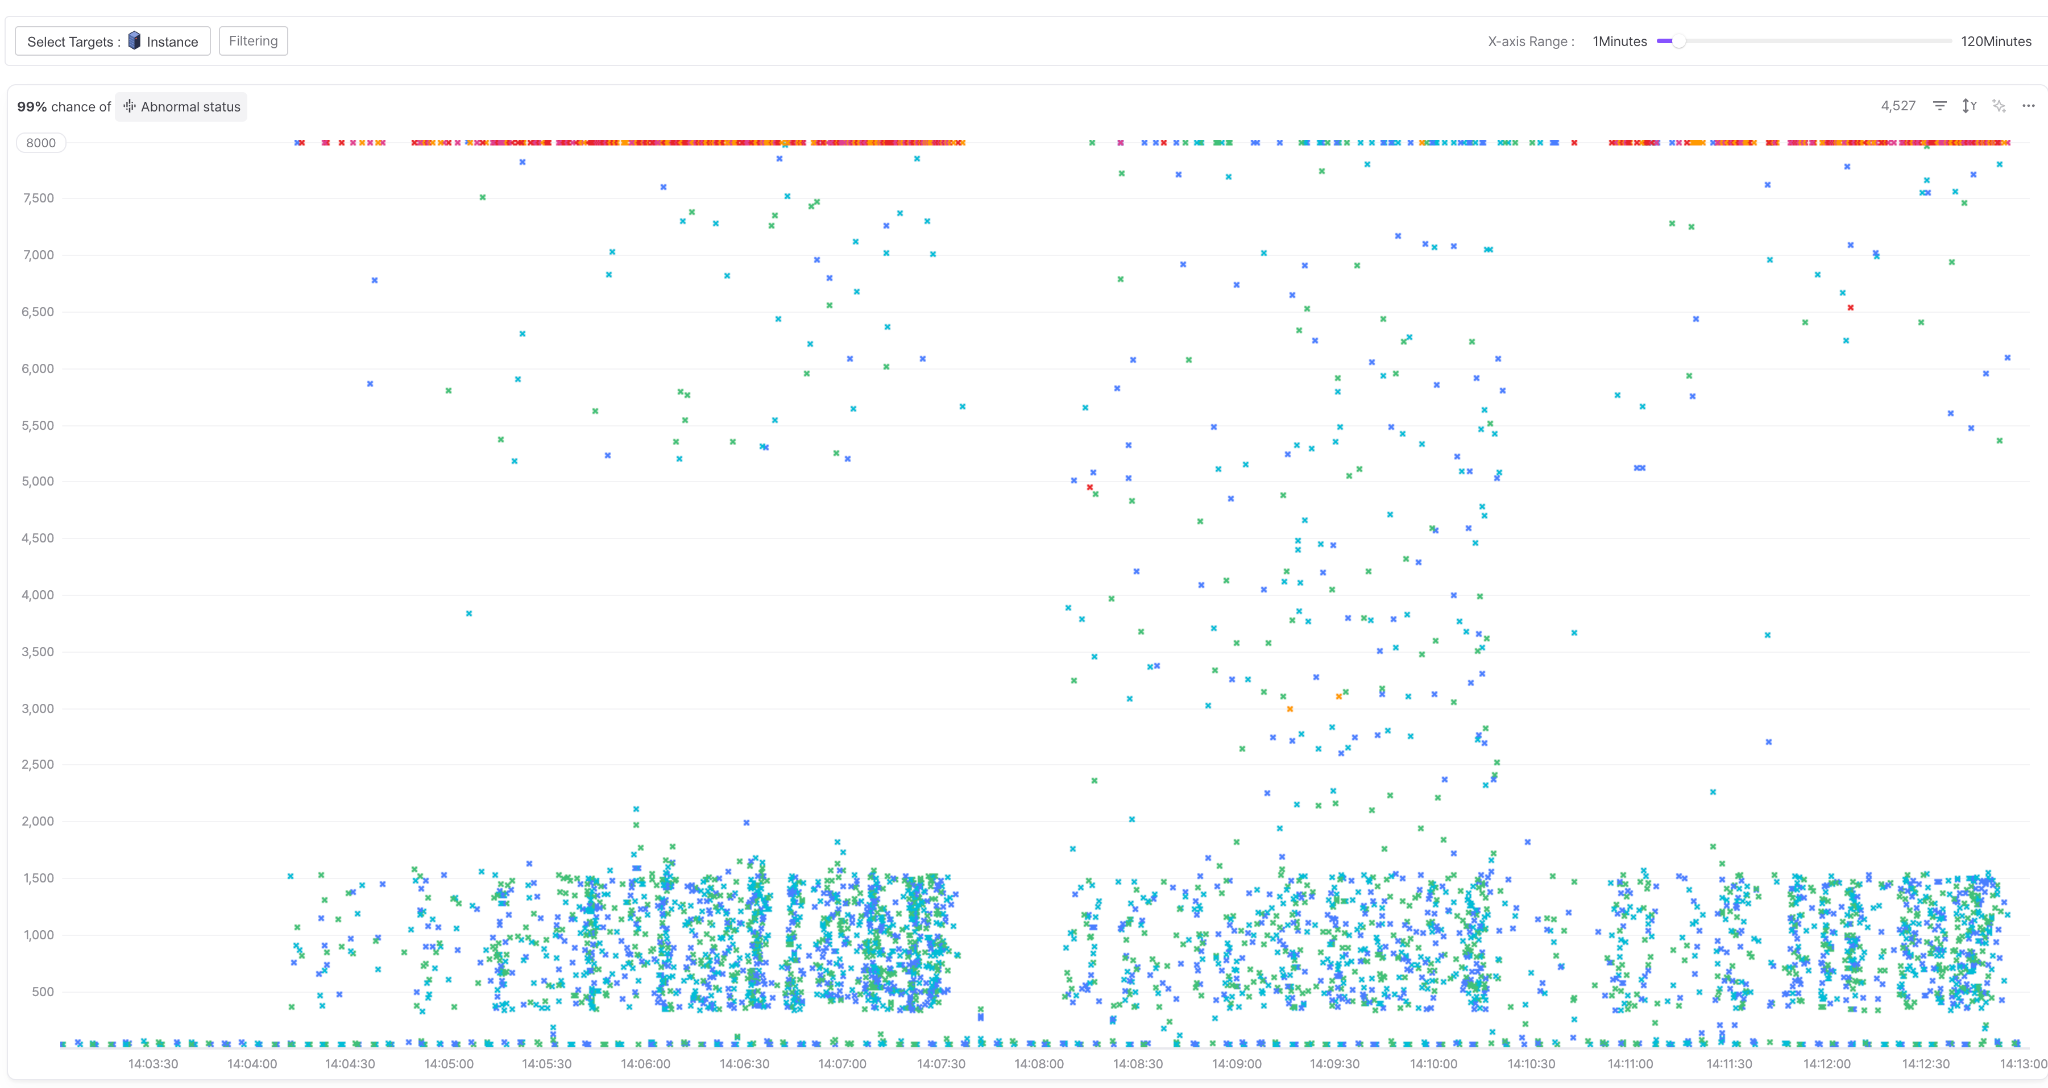
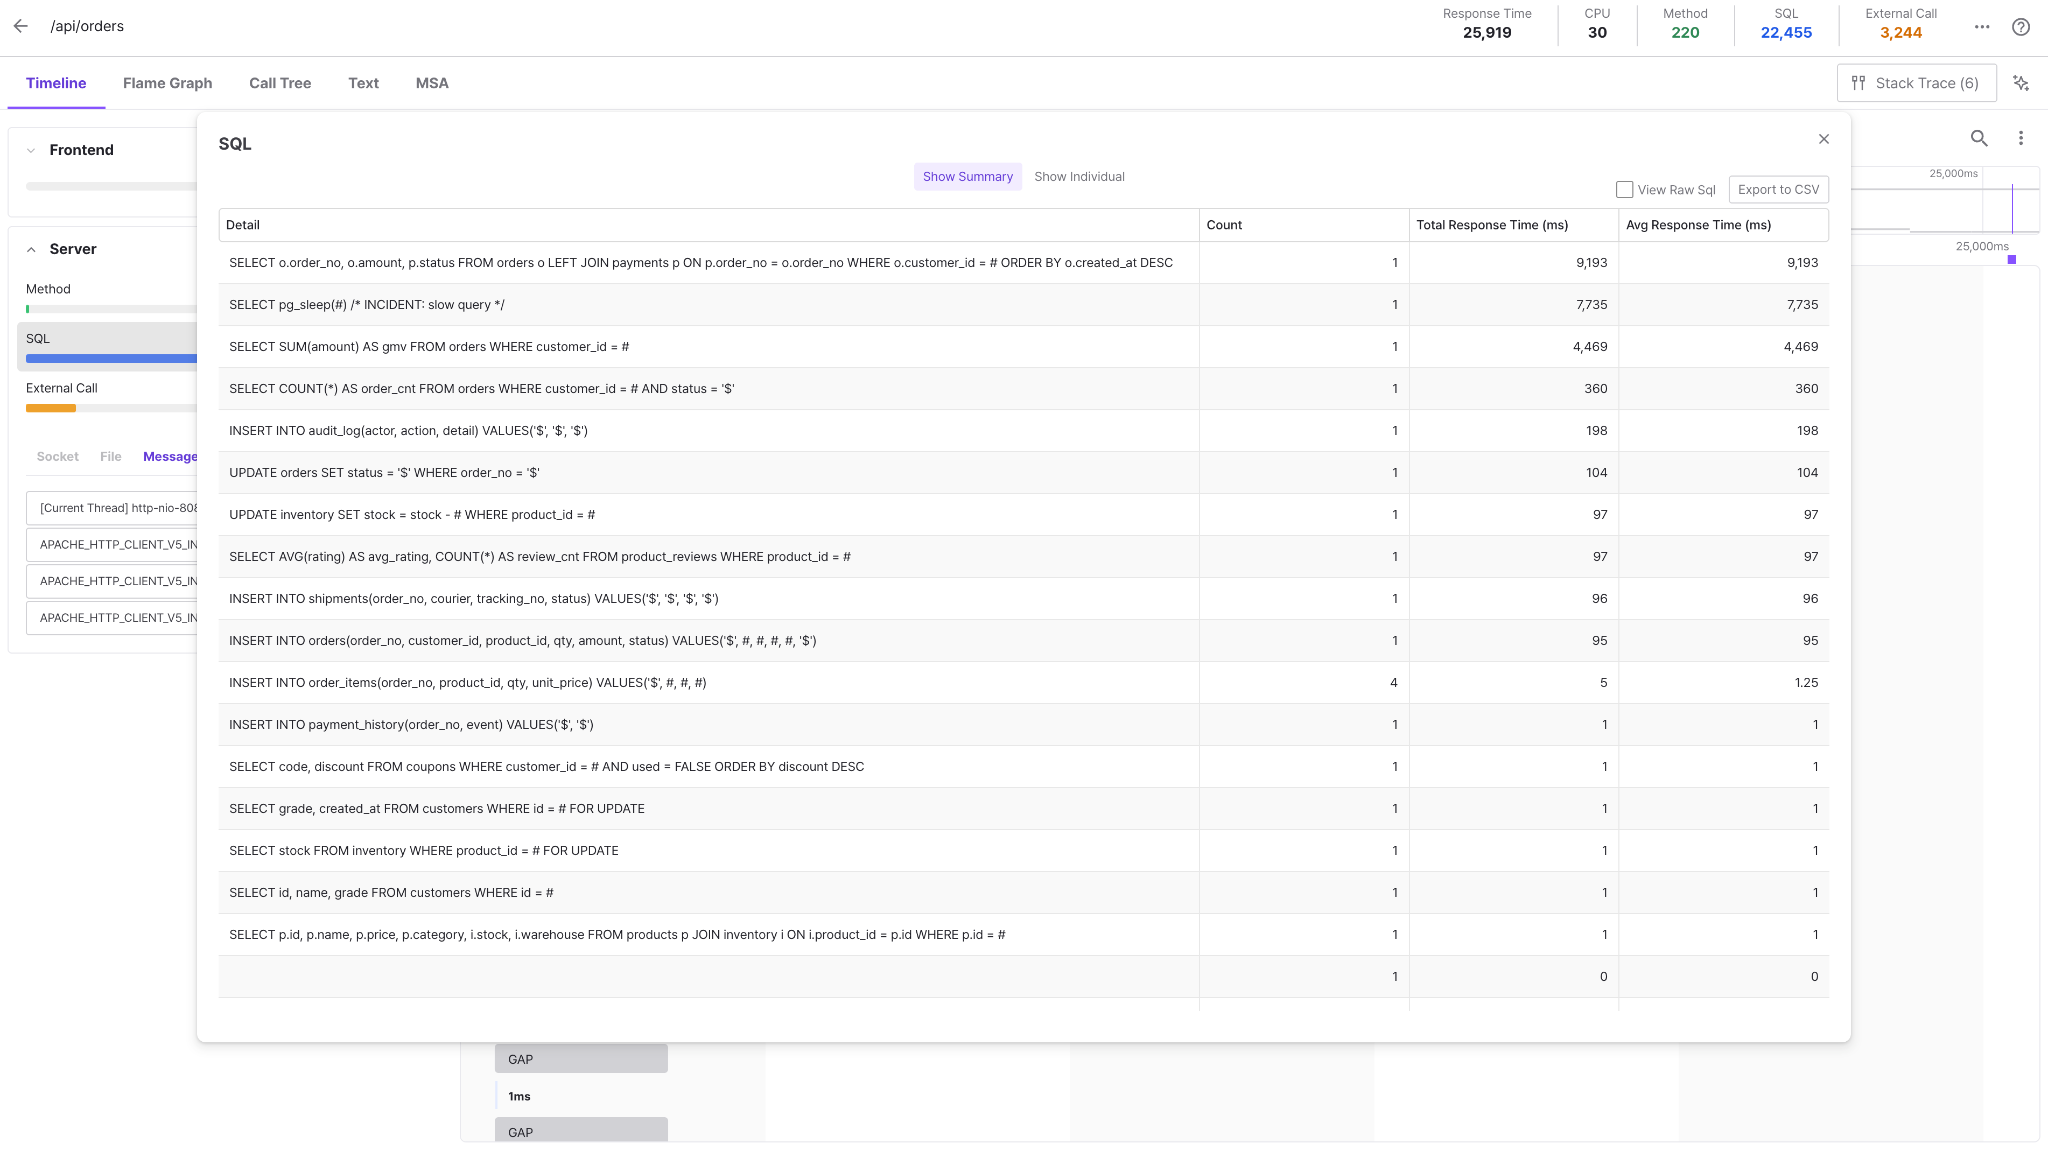
These captures illustrate the workflow; they do not establish that the screens show one continuous transaction.
WHAT THE WORKFLOW GIVES YOU
See active transactions and identify requests that are taking unusually long.
Active Service Status
Concept illustration · 26 seconds · SilentActual product recording · Controlled demo trafficUse X-View to recognize slow transactions and unusual response-time patterns.
X-View
Concept illustration · 26 seconds · SilentActual product recording · SQL and external HTTP casesInspect an individual transaction across application methods, SQL, external calls, and errors.
SUPPORTED ENVIRONMENTS
JENNIFER supports major platforms used for business-critical web applications. Confirm runtime and version coverage for your environment during evaluation.
Explore JENNIFER platformsAPPLICATION PLATFORMS
MODERN APPLICATION ENVIRONMENTS
KUBERNETES & MICROSERVICES
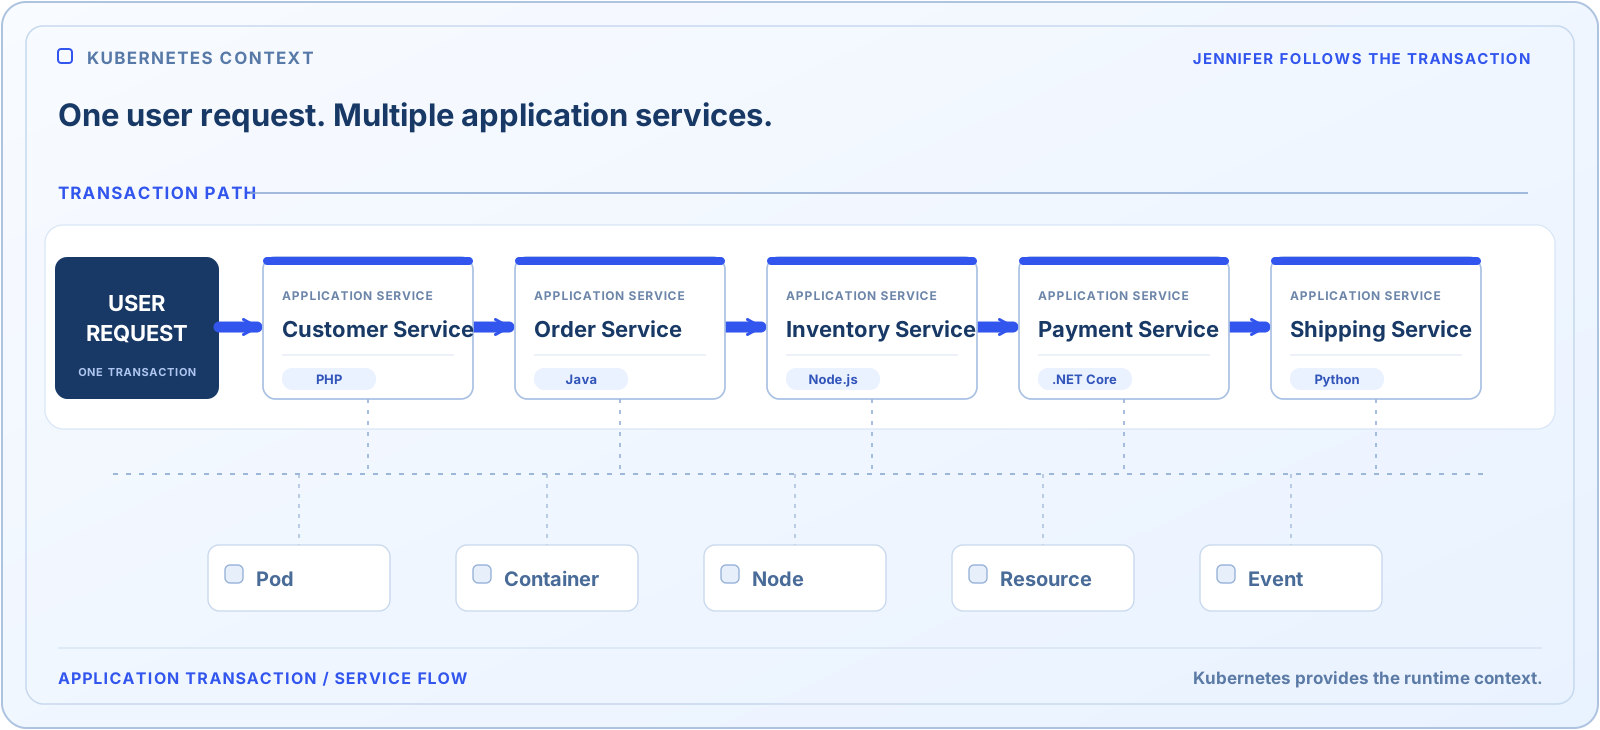
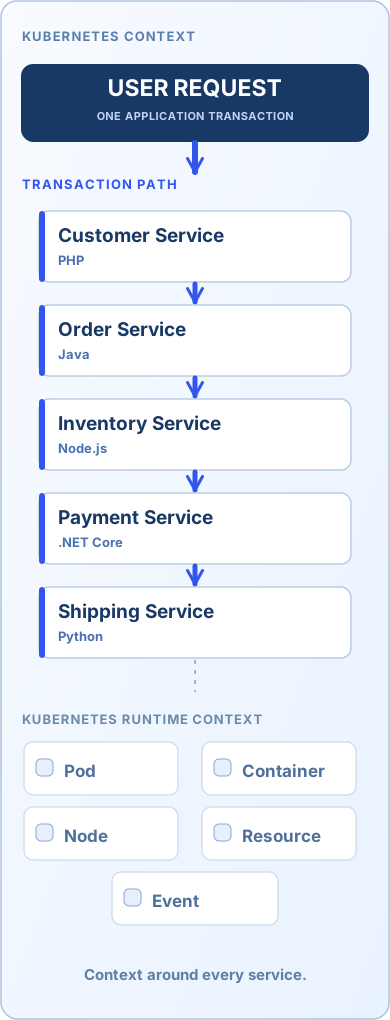
Applications run as services. Transactions move across them. Kubernetes provides the runtime context.
ACTUAL PRODUCT PROOF
From the transaction path to its runtime contextMSA TRANSACTION FLOW
See how a single request moves across services, databases, and external calls.
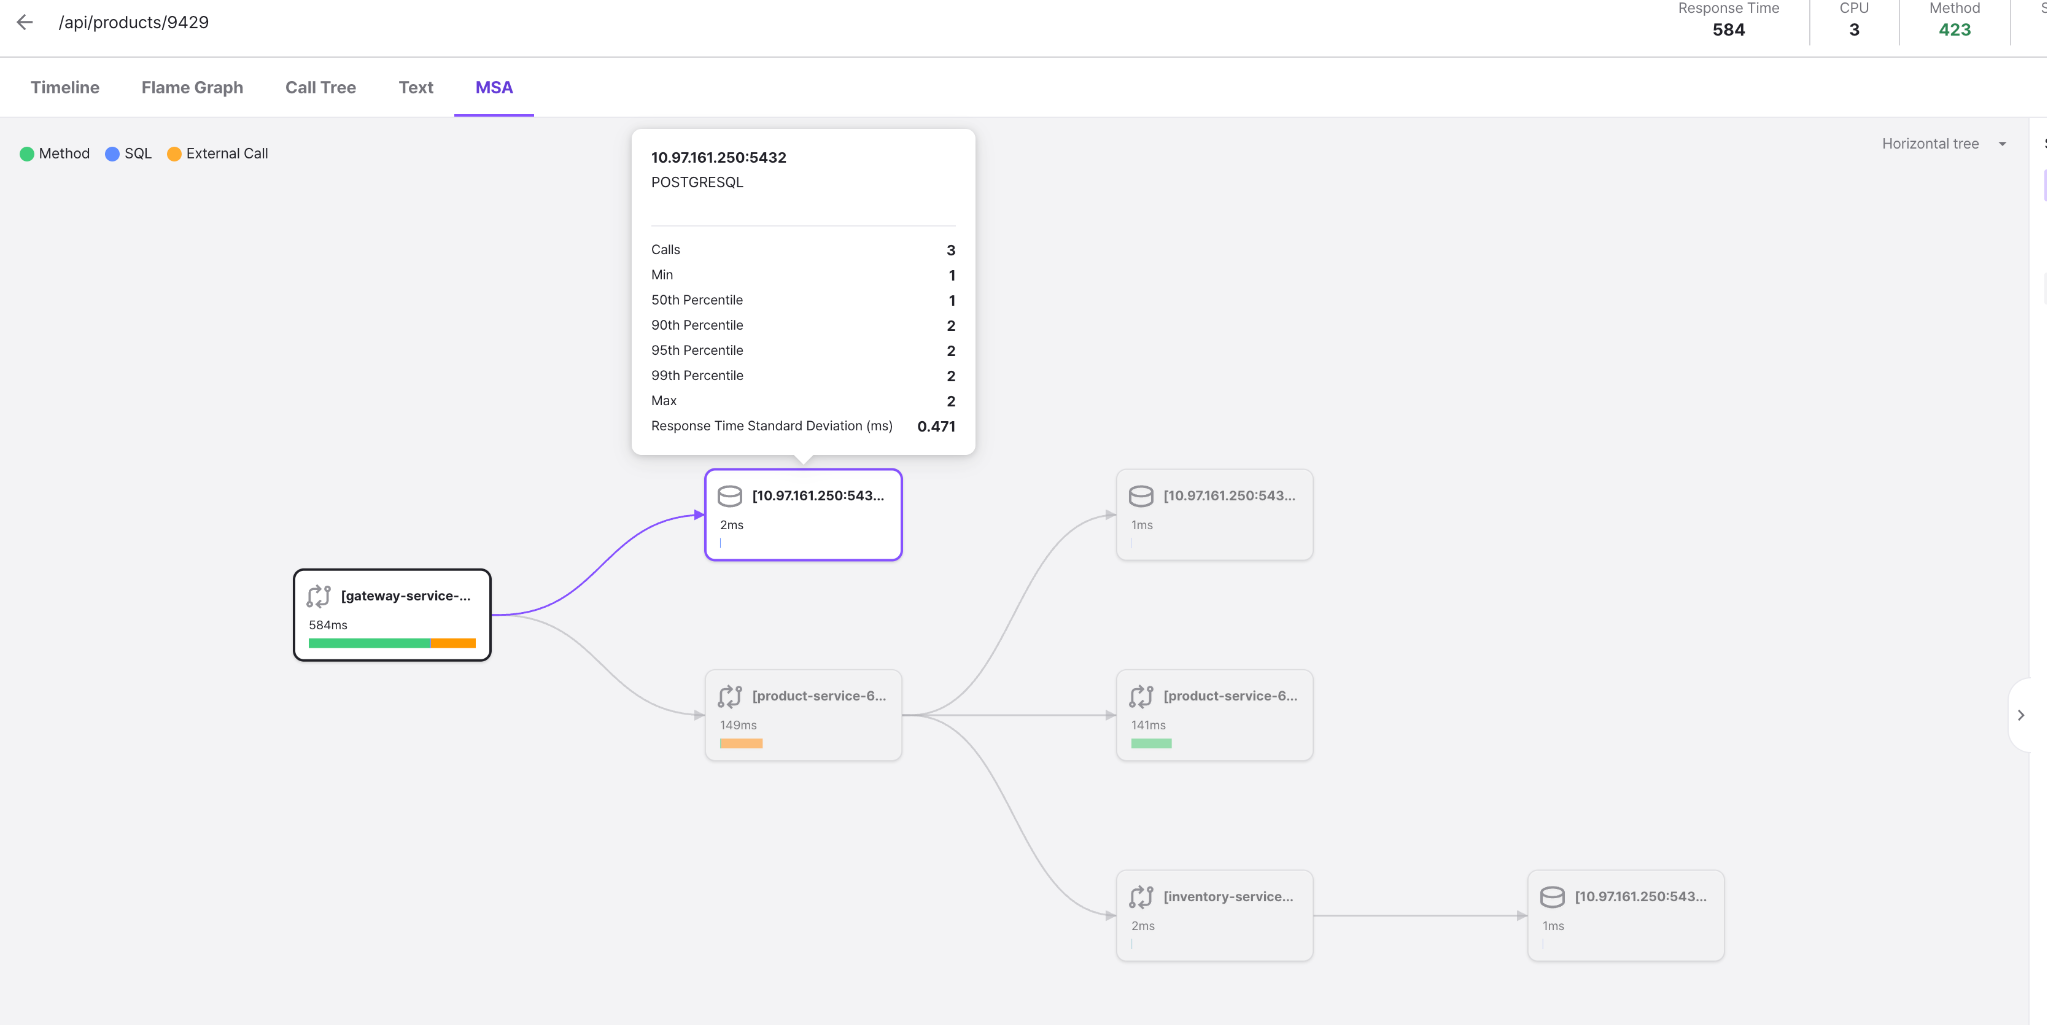 View full screen ↗
KUBERNETES RUNTIME TOPOLOGY
Connect the application service to the Kubernetes resources and runtime behind it.
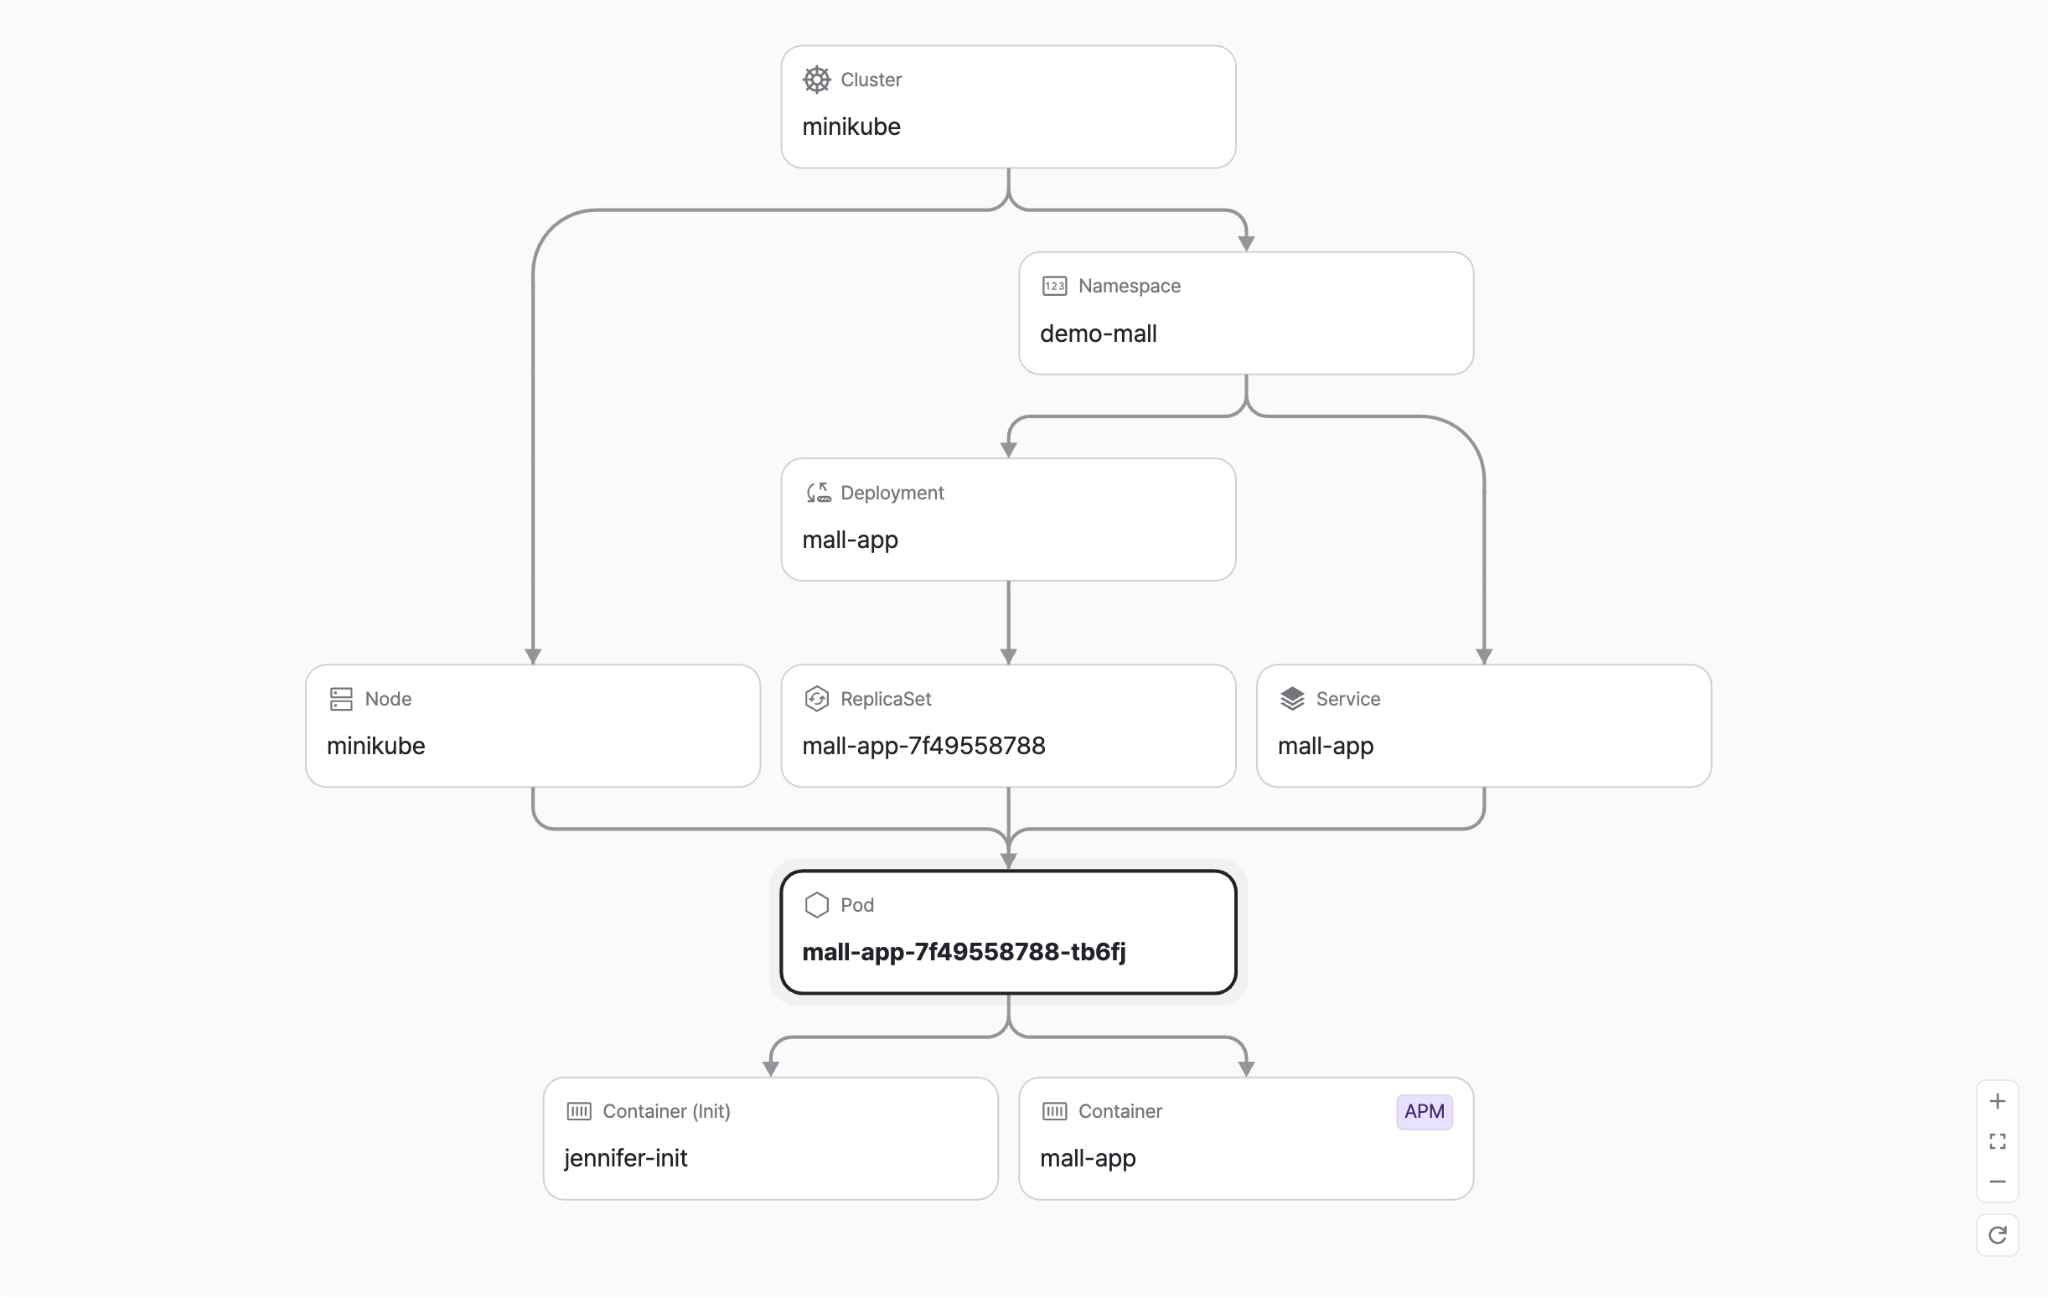 View full screen ↗
Separate product captures show the transaction view and runtime topology; they are not one continuous request in the same environment.
A separate recorded walkthrough of an MSA request and its Kubernetes runtime context.
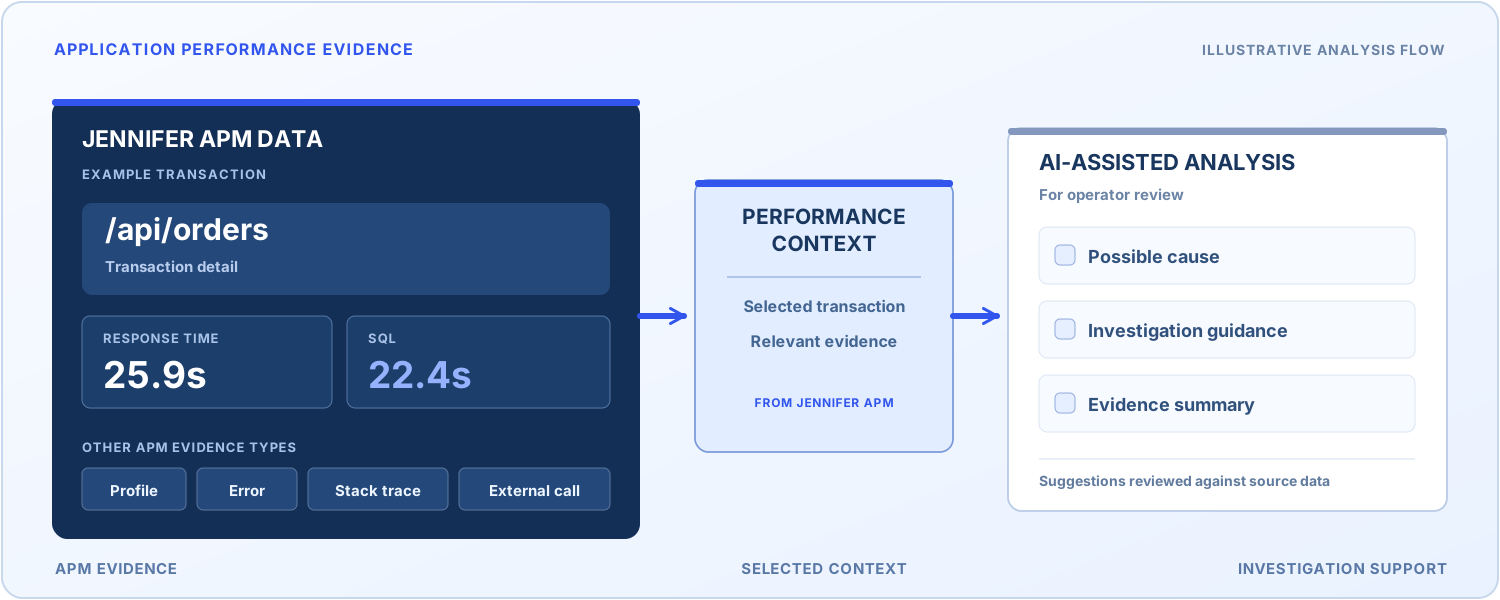
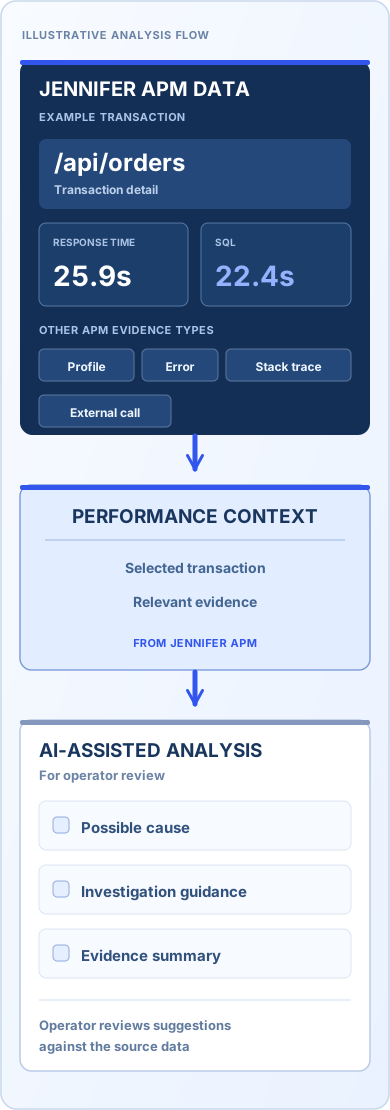
JENNIFER INSIGHTS
Use selected transaction details, profiles, errors, stack traces, response times, and SQL / external-call context to support investigation. Review AI suggestions against the source APM data.
JENNIFERSOFT / COMPANY TRUST
JenniferSoft has focused on APM since 2005. Experience with customers in South Korea and Japan has shaped our product expertise and our sales, technical support, and marketing capabilities.
Continued product development focused on APM.
JENNIFER customers in South Korea.
JENNIFER customers in Japan.
SELECTED ENTERPRISE CUSTOMERS
JENNIFER IN USE AROUND THE WORLD
FOR POTENTIAL PARTNERS
Considering JENNIFER for your market? Explore the product, the customers it serves, and how JenniferSoft can support your sales and technical work.
JENNIFER APM
See how JENNIFER connects live transaction monitoring to the analysis of slow requests.
Interested in partnership? Explore Partnership →