01
Users are still waiting
A user sends a request, but no response comes back. An engineer checks the logs and metrics. The service is clearly slow. But it is hard to see what the request is doing inside the server, or where it is taking time.
Users wait while the operations team struggles to find the cause. We wanted to ease that frustration. Could we see what was happening inside, without waiting for the request to finish? That question was the start of JENNIFER.

02
Before a request ends
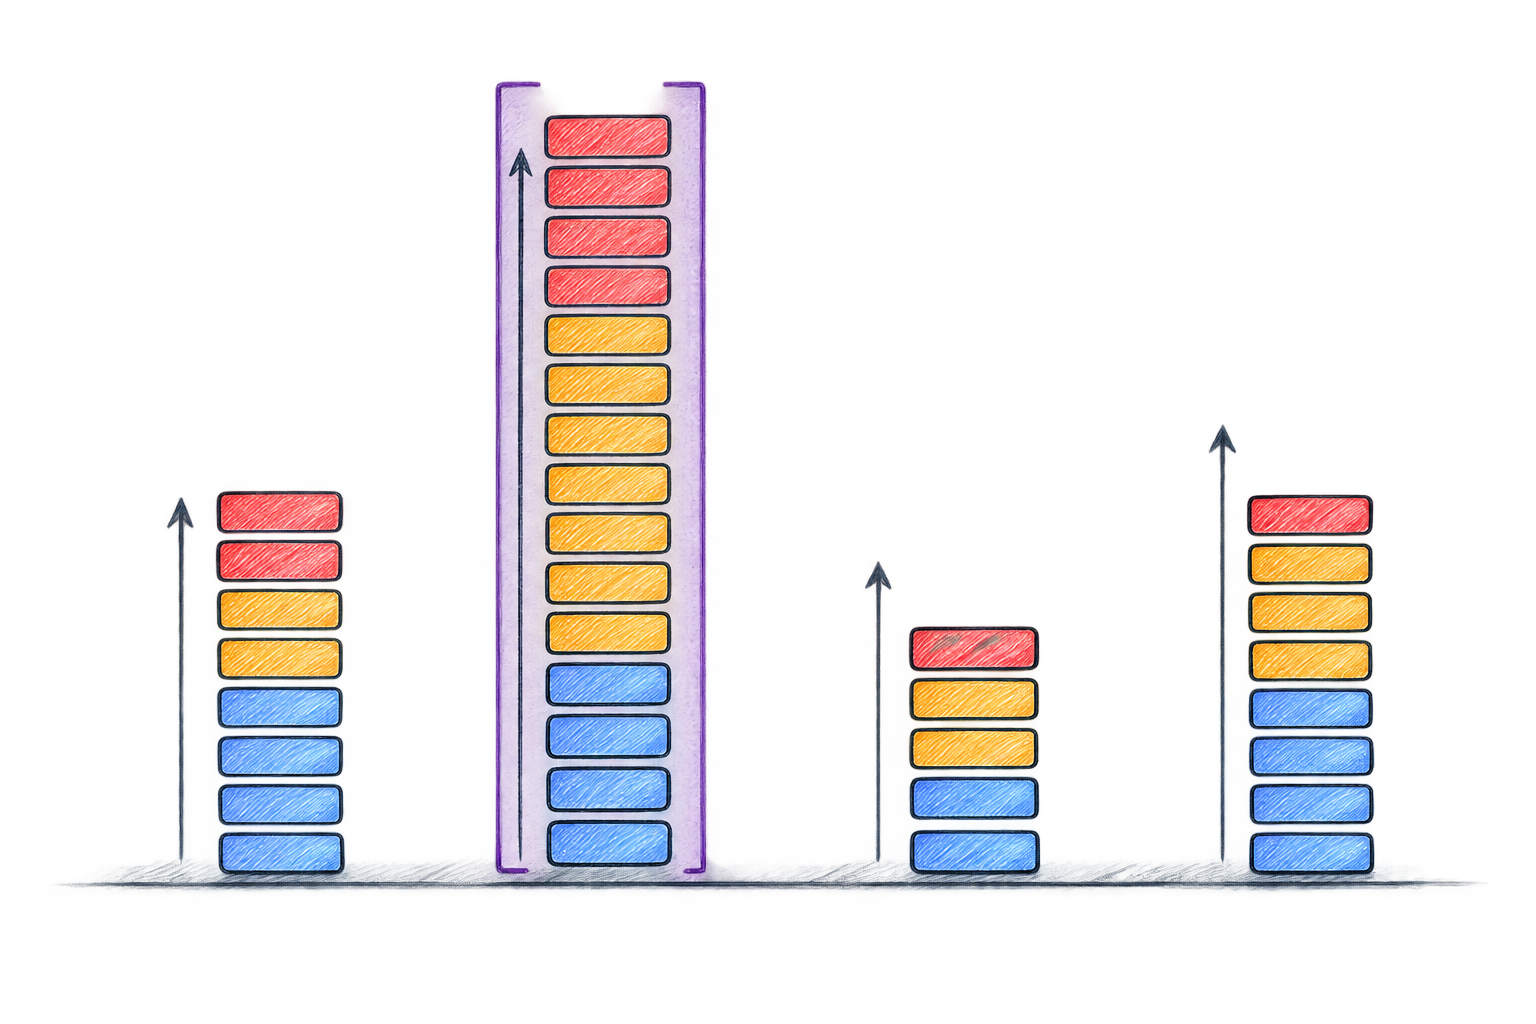
We wanted to bring running requests into view. Which requests had arrived? How long had each one been running? Which ones were taking unusually long? We wondered what it would be like to see all this at a glance.
We turned that idea into Active Service. It shows running requests with elapsed time and colors, so engineers can look at long-running requests right away. We wanted to go beyond checking records after a problem had passed. We wanted engineers to see it while it was happening.
03
Spotting slow requests
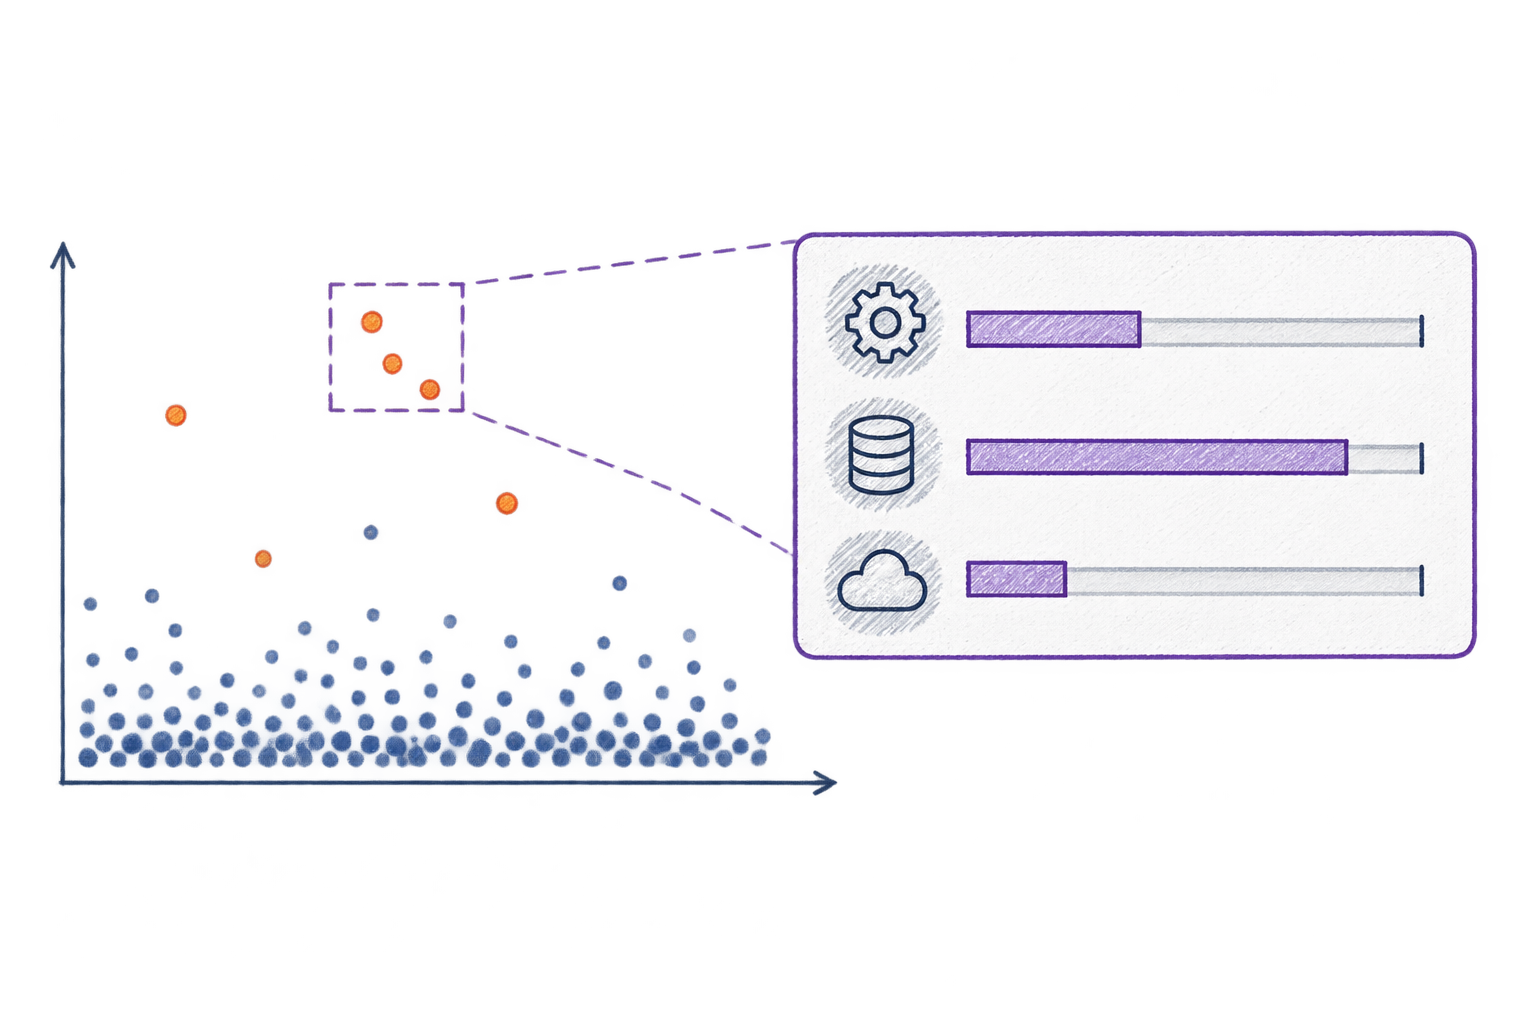
Even after a request ended, questions remained. Which requests had been slow among so many? And which tasks inside them had taken time?
We decided to show each request as a dot. Placing requests that took longer higher up made them easy to spot. That became X-View. Engineers can select a dot that stands out, then look at methods, SQL, and external calls to find where the time was spent.
04
As applications became more varied
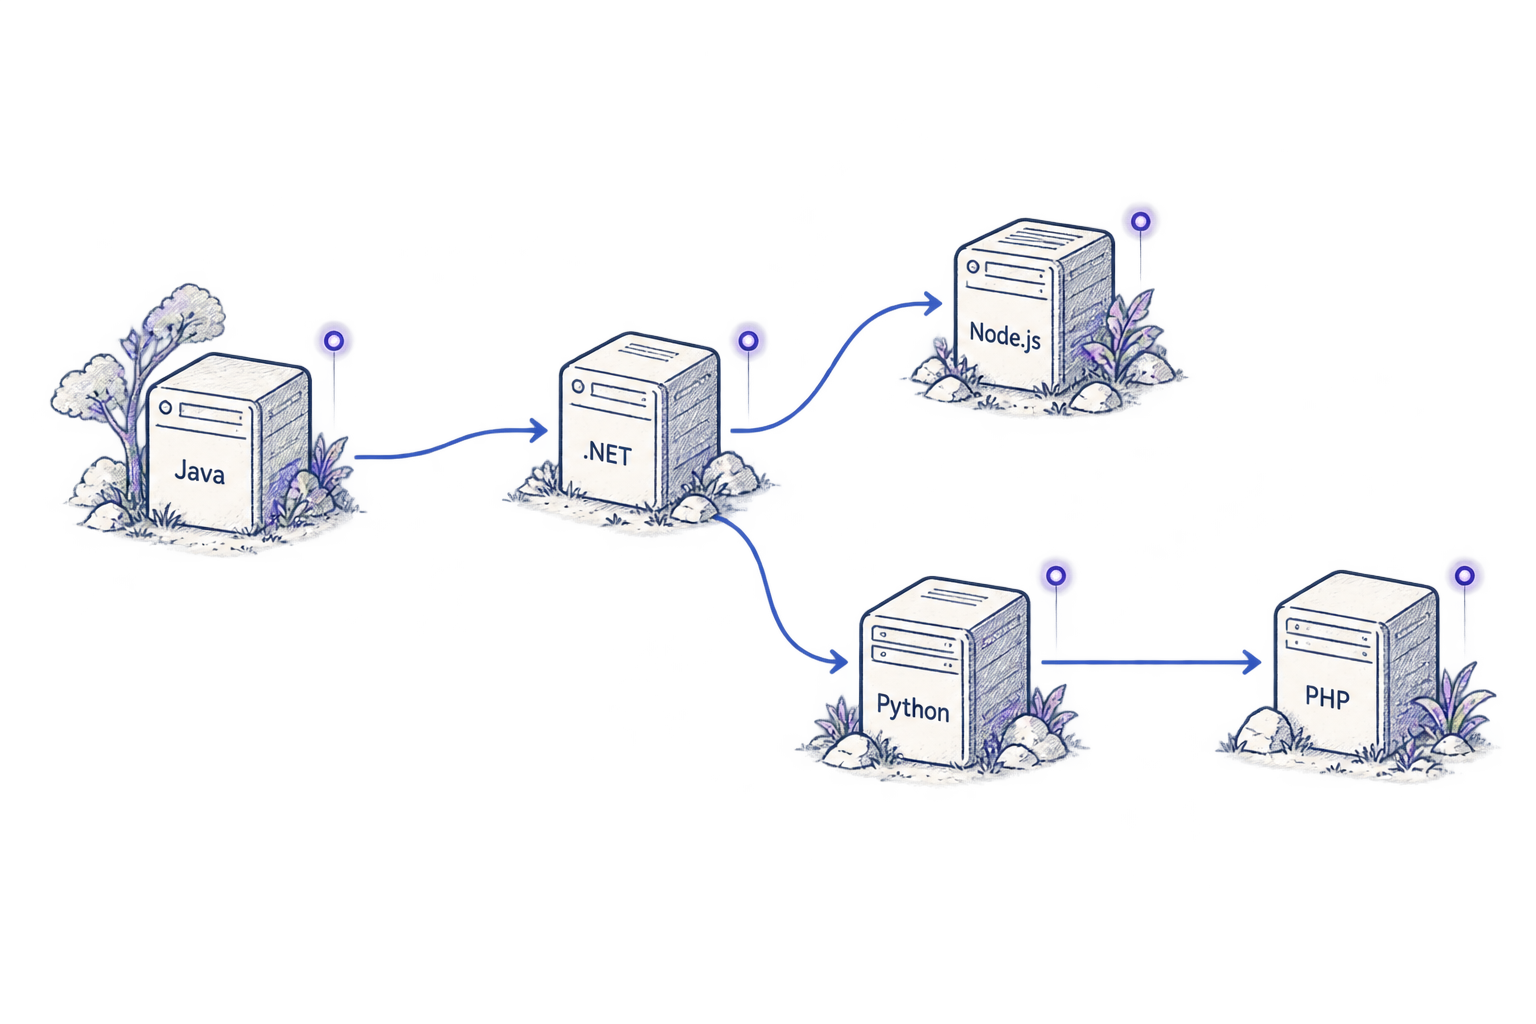
The languages and methods used to build applications became more varied. But operations teams still wanted to know much the same things. Which requests were slow? What was happening inside them?
JENNIFER grew with these changes. We expanded support beyond Java to .NET Core, PHP, Node.js, and Python. We wanted teams to understand application performance and investigate problems in a consistent way across these environments.
05
Finding your way in Kubernetes
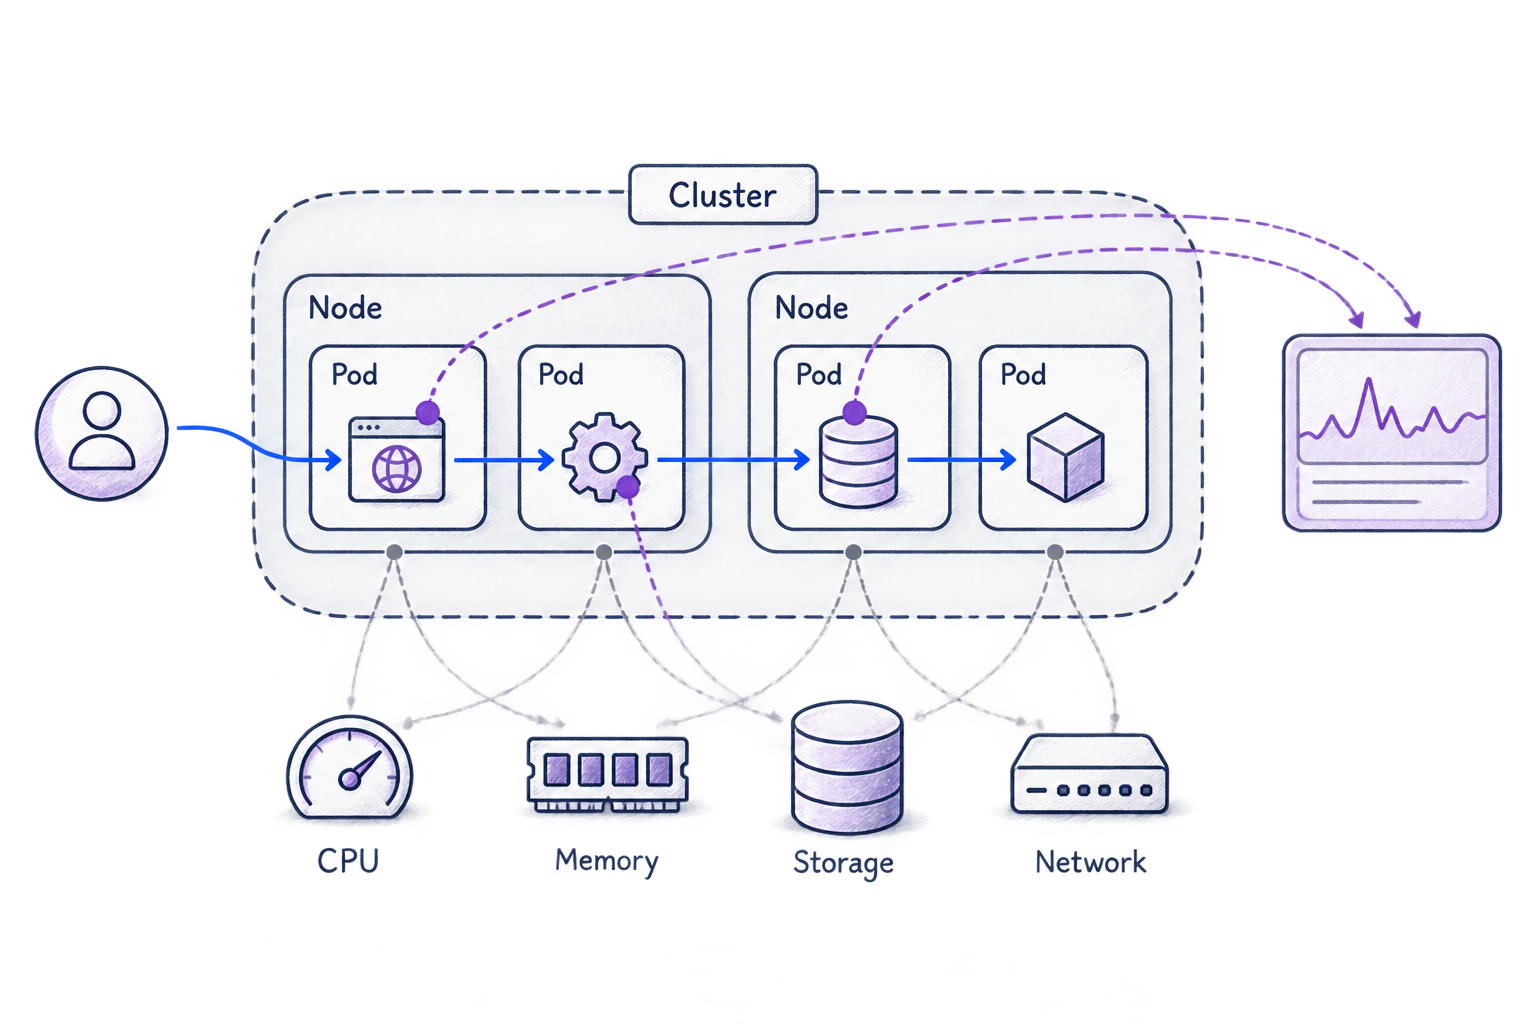
A single request now passes through several services. Applications run in Kubernetes, and services connect through a microservices architecture (MSA). When a request slows down, engineers need to look inside the application. They also need to check what happened to the related pods and nodes.
JENNIFER Kubernetes lets teams view transaction flows alongside Kubernetes status and events. Even as systems become more complex, we want to help customers find where to start looking. That remains the role of APM as environments change.
06
Ask questions in JENNIFER
As you look through JENNIFER, questions come up. Why did this request take so long? What does this error mean? Where should I look next?
We thought it would help to ask those questions directly in JENNIFER. You could ask as you explored, even if reading performance data was new to you, or the problem was hard to work through alone.
So we connected the performance data collected by JENNIFER to a large language model (LLM). You can ask about the data you are viewing, read the answer, and ask follow-up questions to narrow down the problem. We hope this makes it a little easier for engineers to understand the data and decide where to look next.
Why is it slow? Ask in JENNIFER
JENNIFER performance data
Requests, response times, SQL, external calls, errors
Connected LLM
An external service or a model run by your organization*
Ask and review
Check answers against the records, then ask again
07
Environments change. Our questions remain
The wish to see running requests led us to analyze slow transactions. From there, we added support for more languages and Kubernetes, then new ways to use performance data with AI.
Technology keeps changing, but the problem we want to solve remains. Why are users waiting? How can operations teams find the reason sooner? These questions will continue to guide how we build JENNIFER APM.
