If you use JENNIFER's hexagonal pod view to check the pods on each node, the switch to bars can take some getting used to. At 25 worker nodes or more, the Cluster Dashboard uses a compact bar view to fit the nodes on the screen. It still gives you an overview, but the individual pod view may feel easier to read.
A user-defined dashboard offers a workaround: add multiple Cluster Map charts and select a different group of nodes for each one. With fewer than 25 nodes in each chart, you can keep the hexagonal view and see all the groups on the same dashboard.
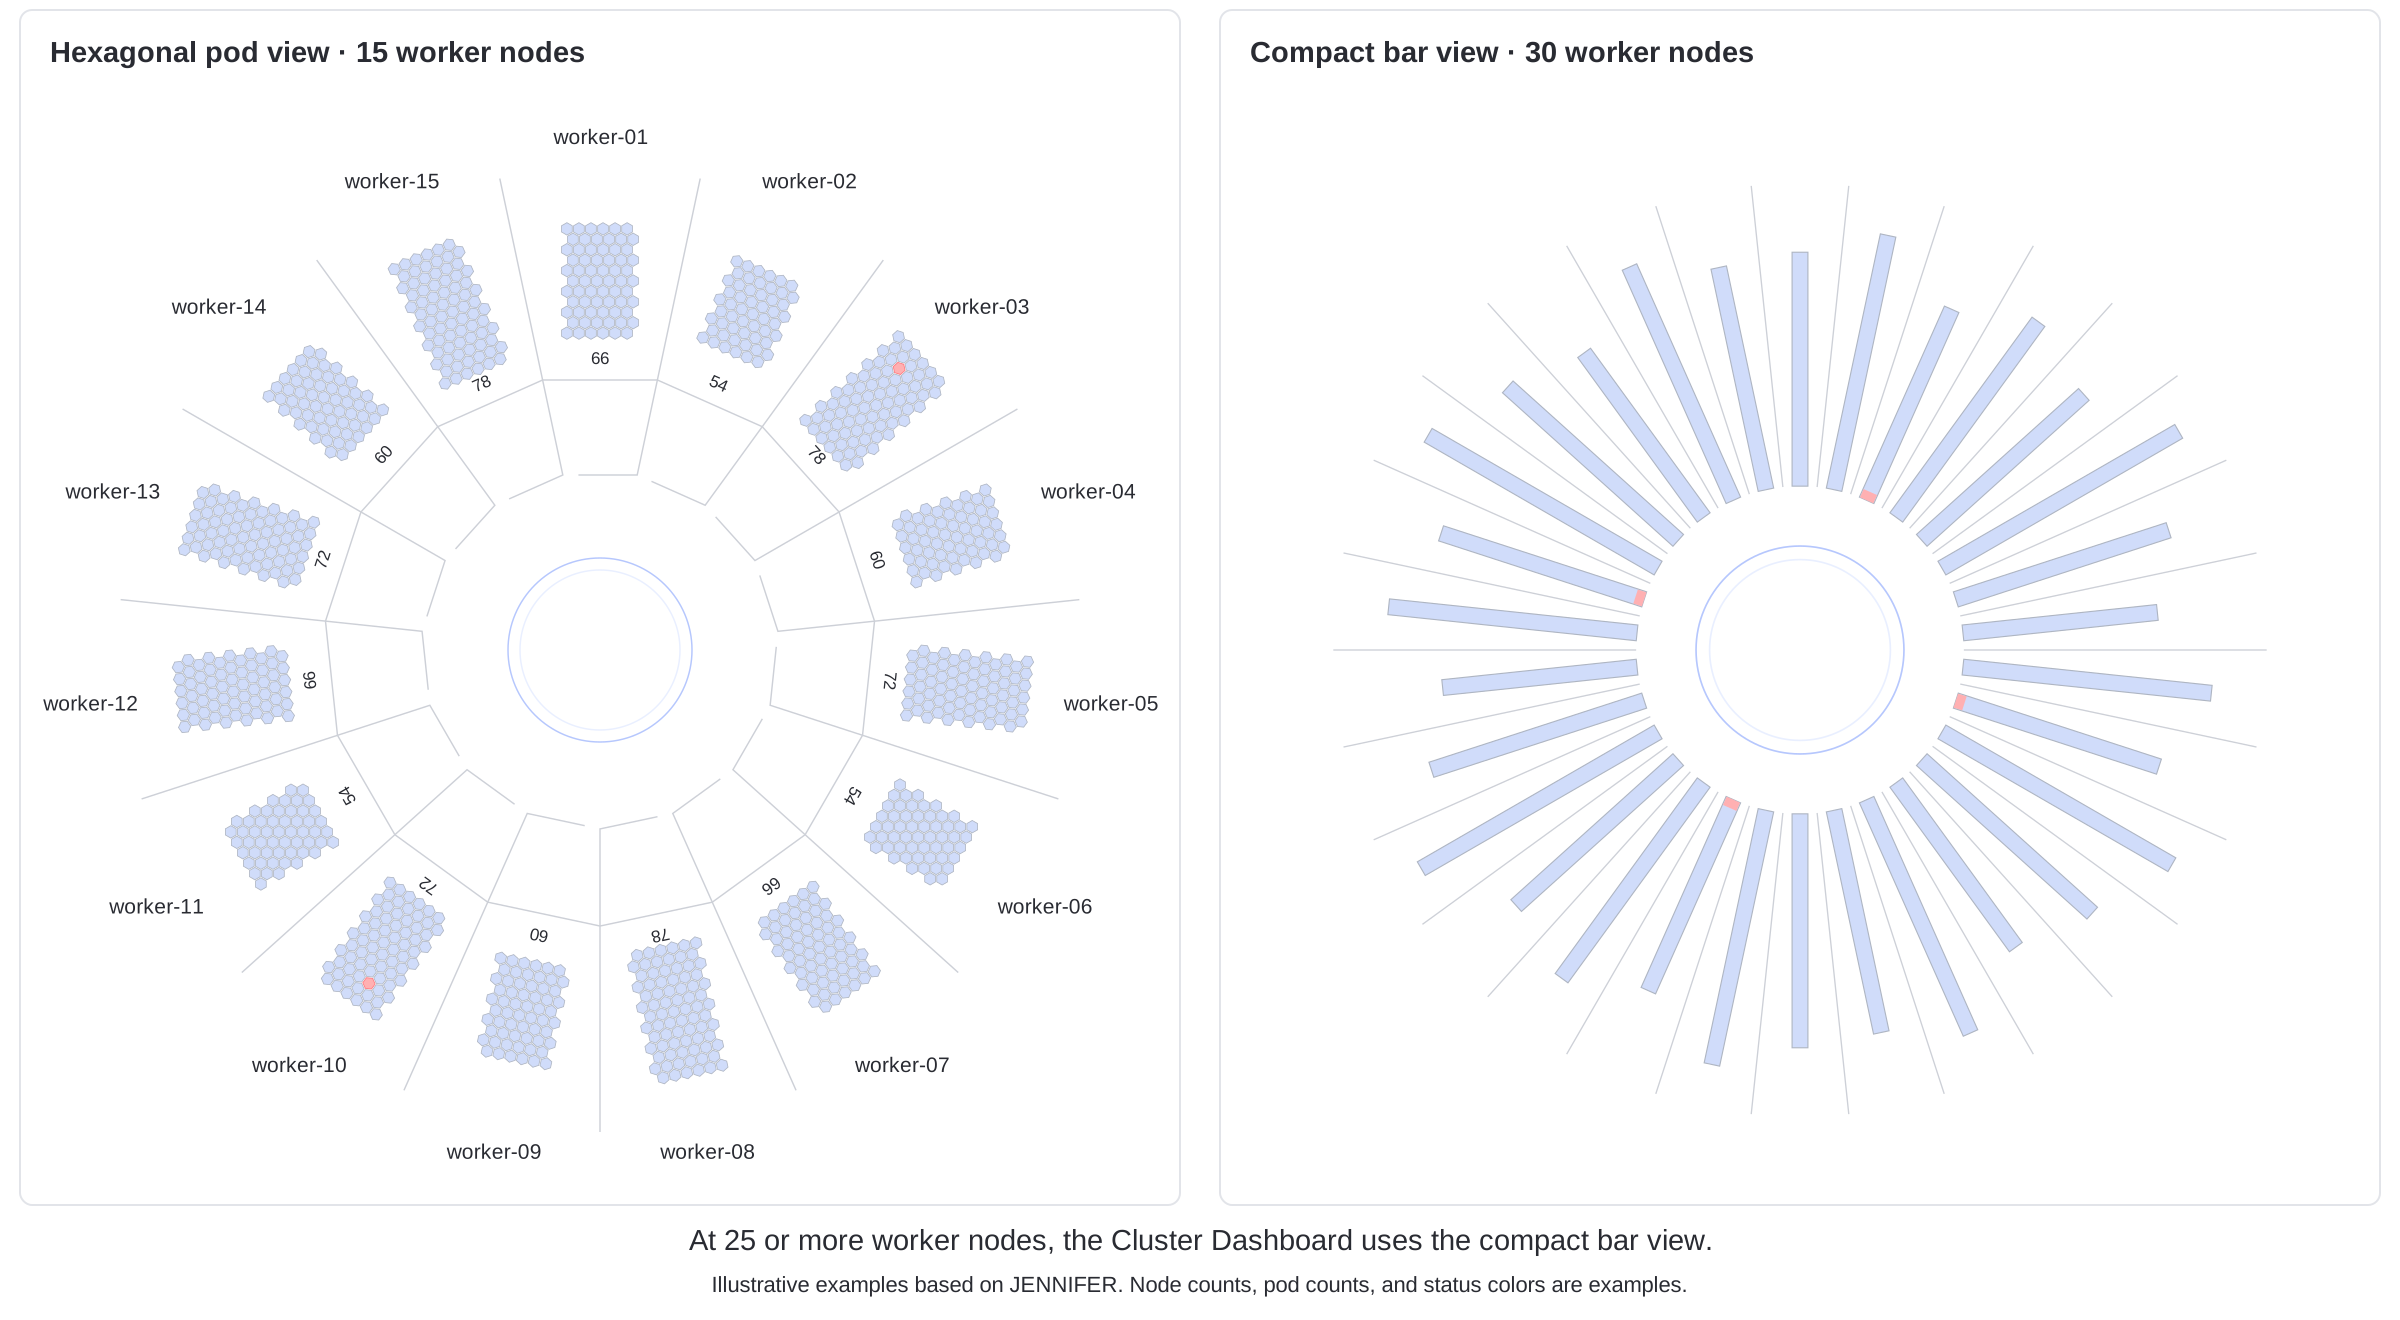
Split 30 worker nodes across two maps
For a cluster with 30 worker nodes, select worker-01 through worker-15 in the first Cluster Map and worker-16 through worker-30 in the second. Set both charts to the same cluster.
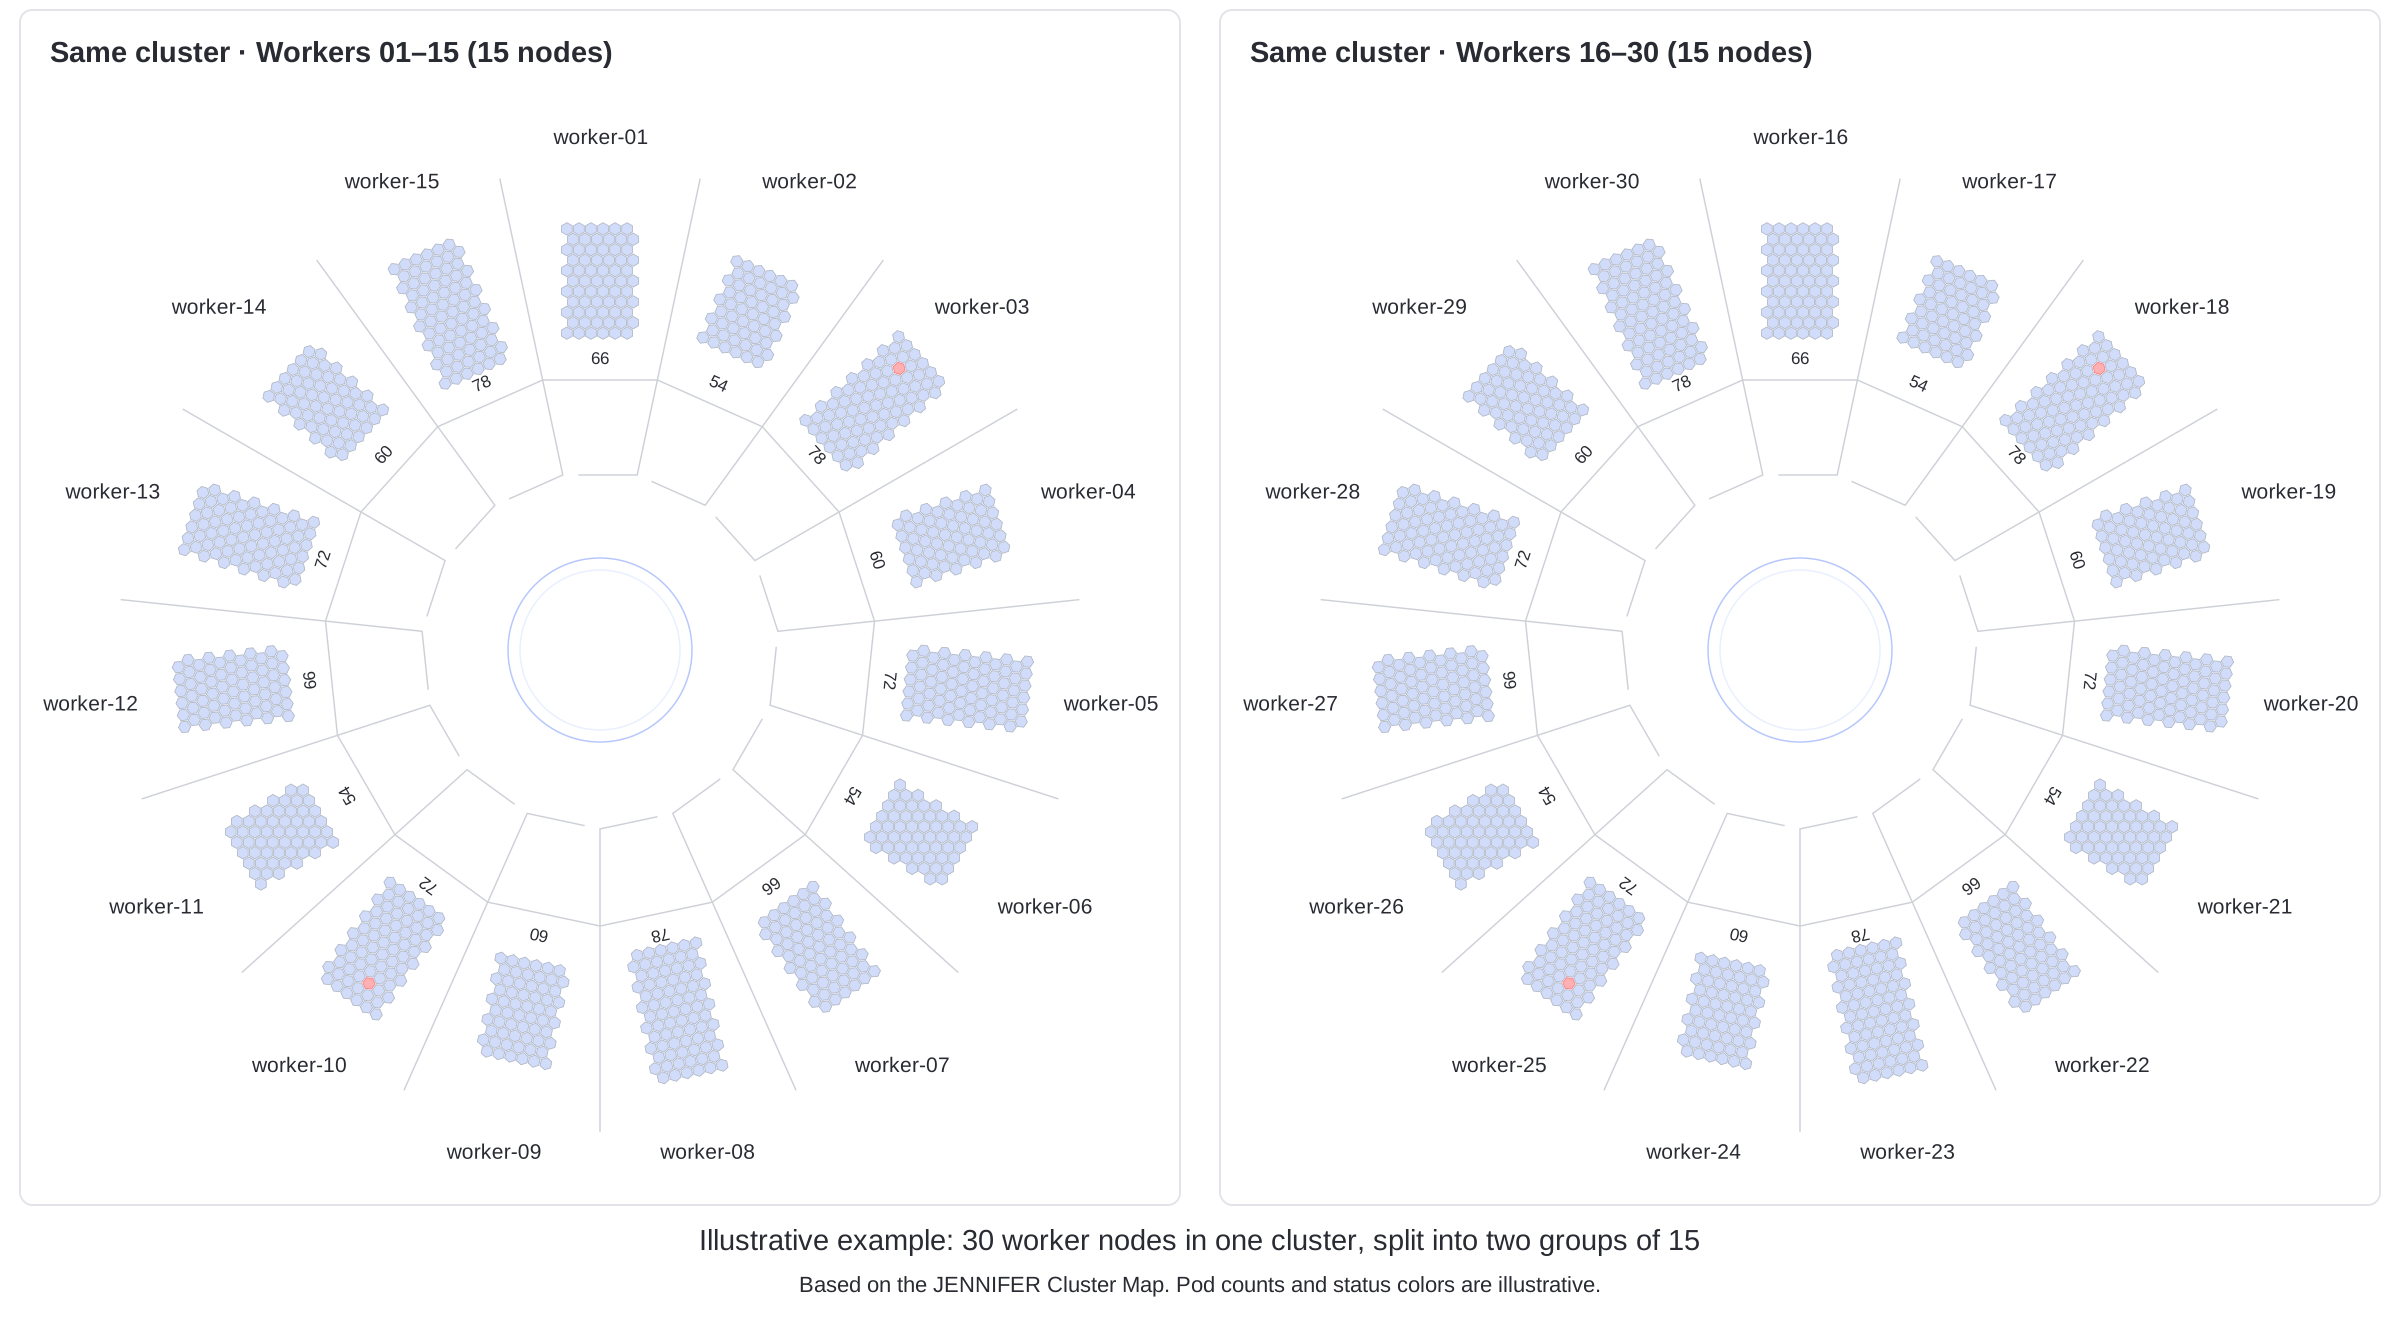
Each chart now has 15 nodes, so both can use the hexagonal pod view. Place them side by side to keep all 30 worker nodes in view. The two circular maps show different parts of one cluster. The cluster and pod placement stay as they are; only the charts' display scope changes.
| Setting | Cluster Map A | Cluster Map B |
|---|---|---|
| Target cluster | The same cluster | The same cluster |
| Selected nodes | worker-01 through worker-15 | worker-16 through worker-30 |
| Node count | 15 | 15 |
Filter each chart by node
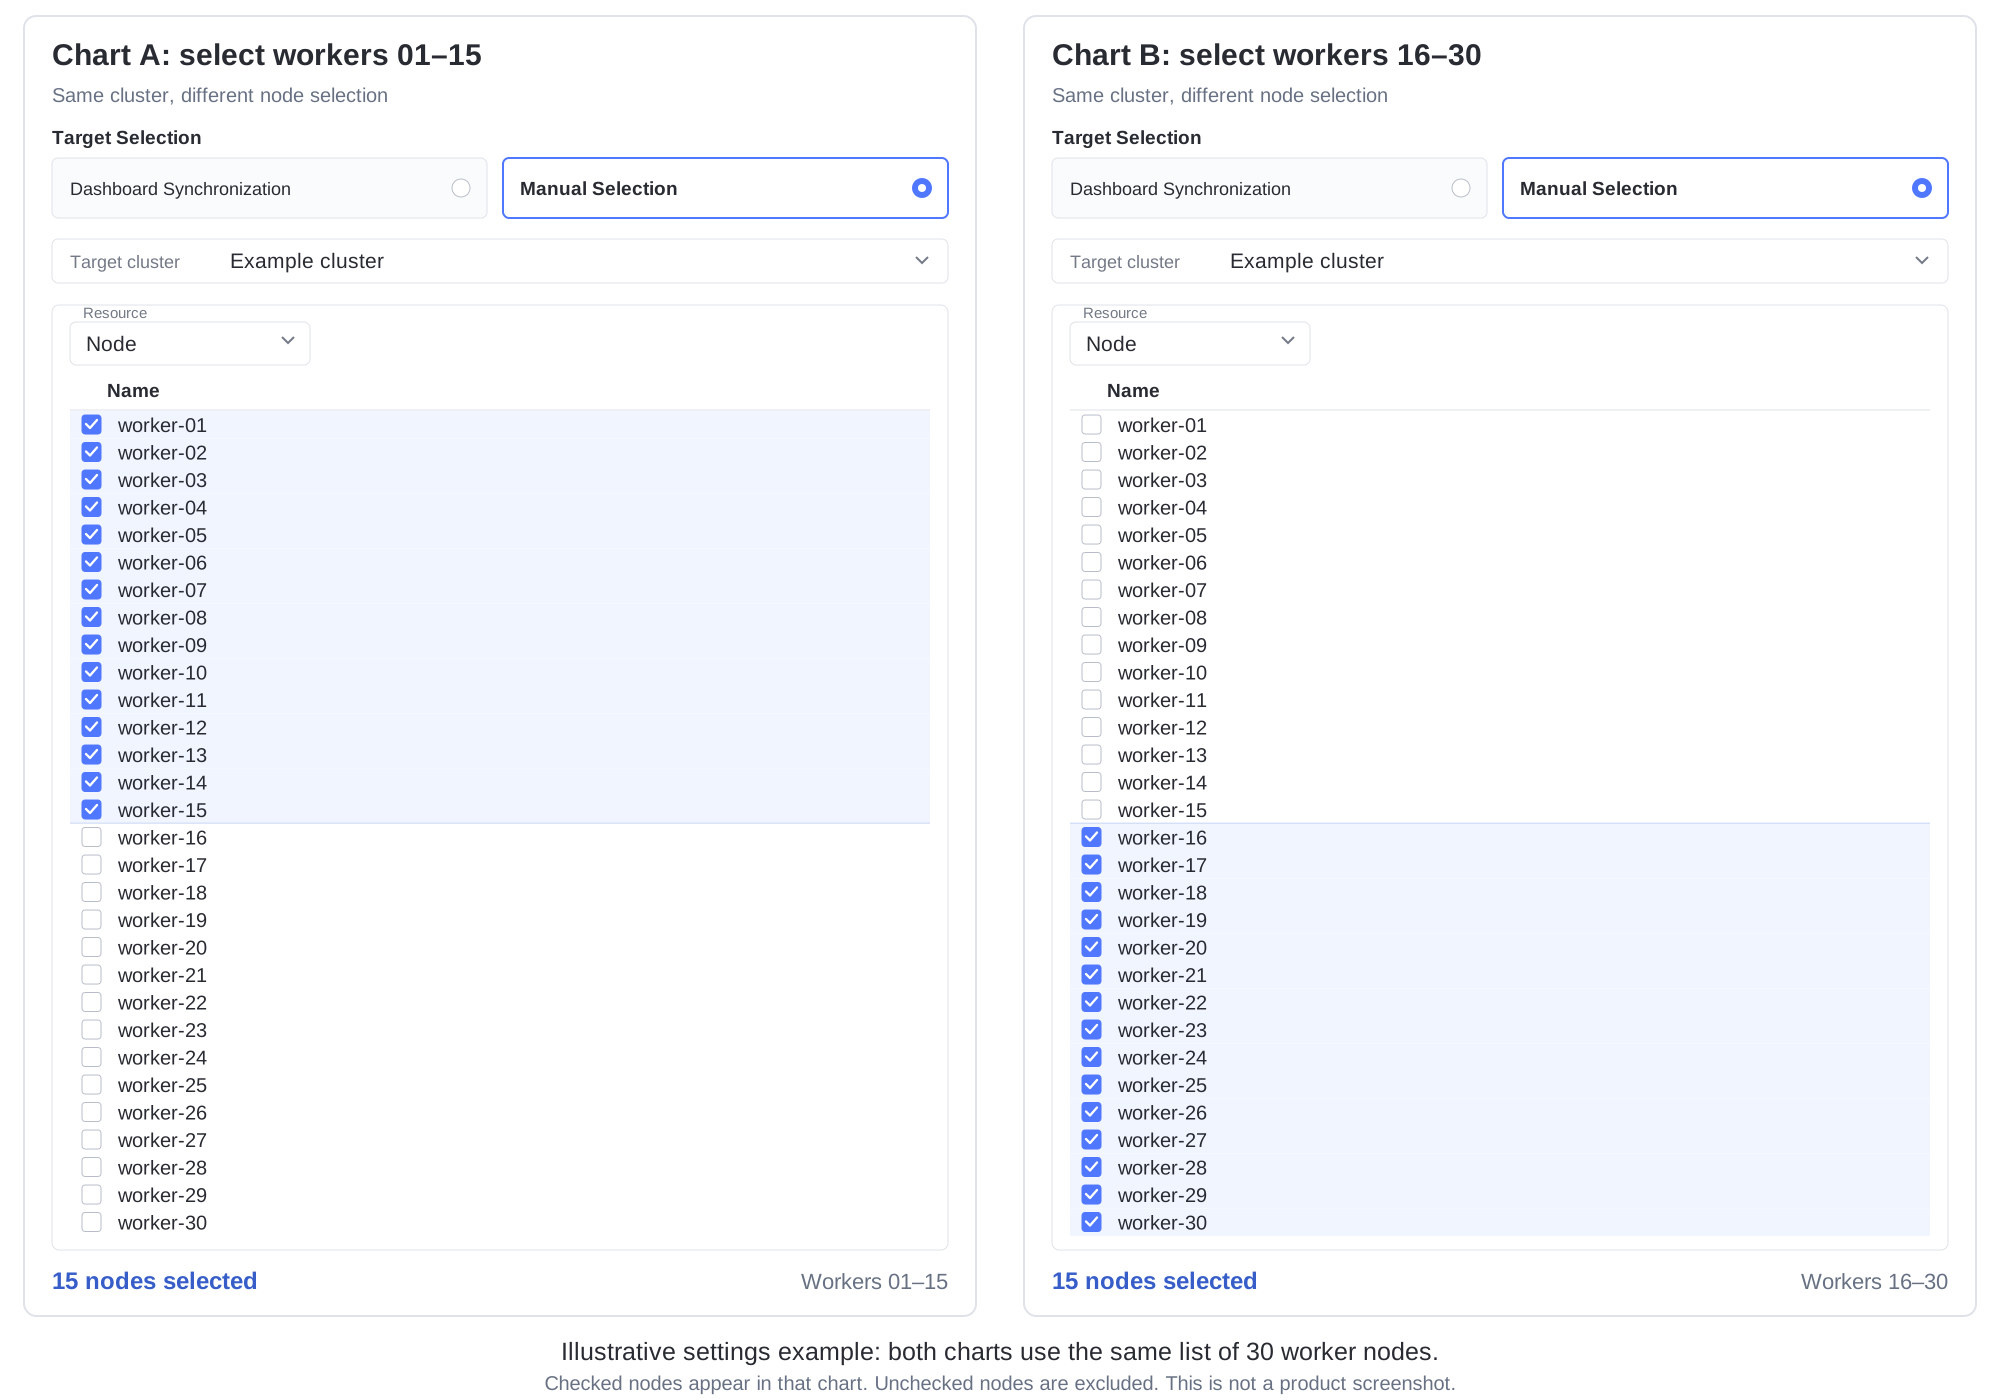
Use Manual Selection in the Cluster Map settings to assign nodes to each chart. This fixes the chart's target scope: changing the cluster or namespace selector at the top of the dashboard will not change the chart's selected targets.
Both charts start with the same list of nodes. In Chart A, check worker-01 through worker-15 and leave worker-16 through worker-30 unchecked. Reverse the selection in Chart B. The checked nodes determine which part of the cluster each map shows.
- Add a Cluster Map chart to a user-defined dashboard.
- Under Target Selection, choose Manual Selection. Set Target cluster to the cluster you want to monitor.
- Under Resource, choose Node. Check worker-01 through worker-15, leave the other nodes unchecked, and save the chart.
- Add a second Cluster Map for the same cluster. Check worker-16 through worker-30 and leave worker-01 through worker-15 unchecked, then save that chart.
- Arrange the charts side by side and give each enough space to make the pods readable. Use titles that identify the cluster and node group, then save the dashboard.
Keep the node lists up to date
Before using the dashboard, check that the two selections cover every worker node you want to monitor, with no unintended duplicates. Check the selections again when nodes are added or replaced so that new nodes are included. If your monitoring scope also covers pods running on control plane nodes, include those nodes too.
The group size does not have to be 15. Choose groups that suit your node count and screen space, keeping each chart below 25 nodes.
The figures are explanatory illustrations based on JENNIFER's cluster visualization and chart settings. Node names, pod counts, and status colors are examples.