Build a dashboard around your team’s needs. Justin, Dana and Sam explore chart composition, node selection and a clearer pod view.
English
JENNIFER KUBERNETES · FIELD NOTES EPISODE 01
Your Cluster. Your View.
Build a clearer view with JENNIFER Kubernetes user-defined dashboards.
01 A question from a customer
PING!
Incoming · Customer
We added more worker nodes. Now the pods look like bars.
Can we get the hexagons back?
Okay, let’s take a look.
02 The view changed. The need didn’t.
SamThe cluster grew. Now it’s harder to pick out the pods.
JustinCan we make them easier to see—and still keep the whole cluster in view?
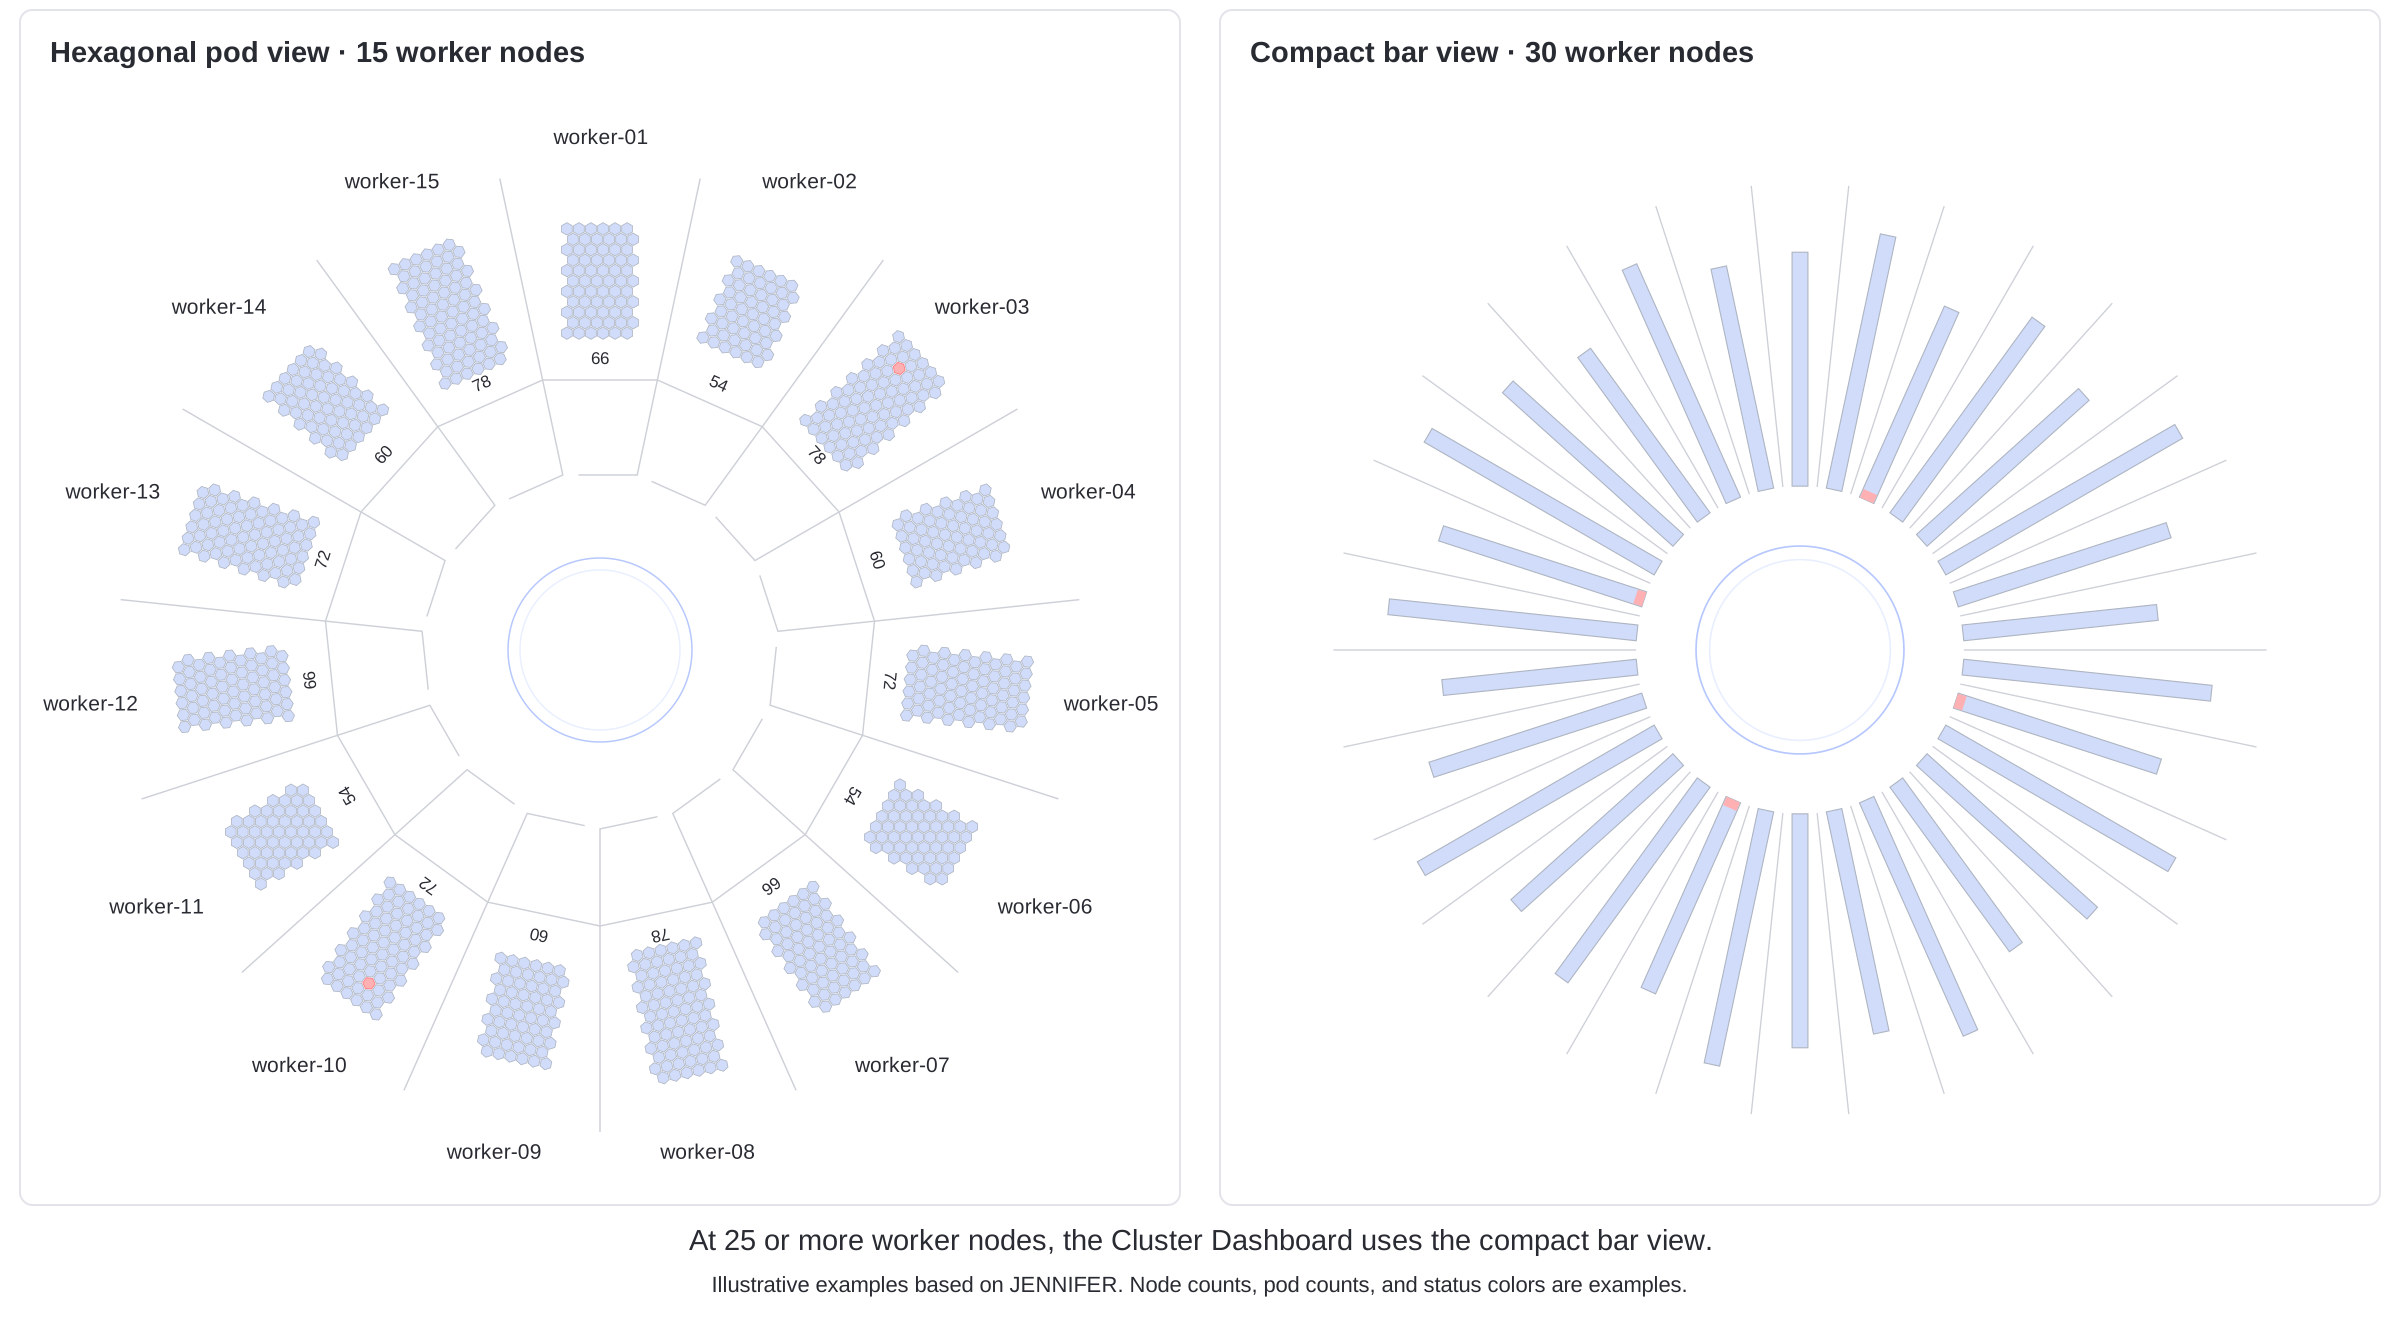
At 25 worker nodes or more, the Cluster Dashboard switches to compact bars.
Hexagonal pod viewCompact bar view
Illustrative examples: 15 worker nodes on the left, 30 on the right.
03 Build it with a user-defined dashboard
DanaLet’s use a user-defined dashboard in JENNIFER Kubernetes. We can build the view they need.
JENNIFER KUBERNETES
User-defined dashboards
01 Add your charts.
02 Choose their nodes.
03 Arrange your view.
04 Choose what each chart shows
DanaAdd two Cluster Map charts. Choose fifteen nodes for each.
JENNIFER KUBERNETES
One user-defined dashboard
30 worker nodes
Same cluster · different chart selections
CLUSTER MAP A
15 nodes
010203040506070809101112131415
worker-01–worker-15
CLUSTER MAP B
15 nodes
161718192021222324252627282930
worker-16–worker-30
Each chart: fewer than 25 nodes.
15 + 15 is one example. Choose group sizes that fit your cluster and screen.
05 Wait. Two clusters?
SamWait. Two clusters?
DanaNope. One cluster. Different nodes in each map.
DanaWe’re choosing which nodes each chart shows.
06 Filter by node. Then arrange the charts.
Let’s build that dashboard.
SamSame node list. I check one half here… and the other half there.
1
In a user-defined dashboard, add two Cluster Map charts.
2
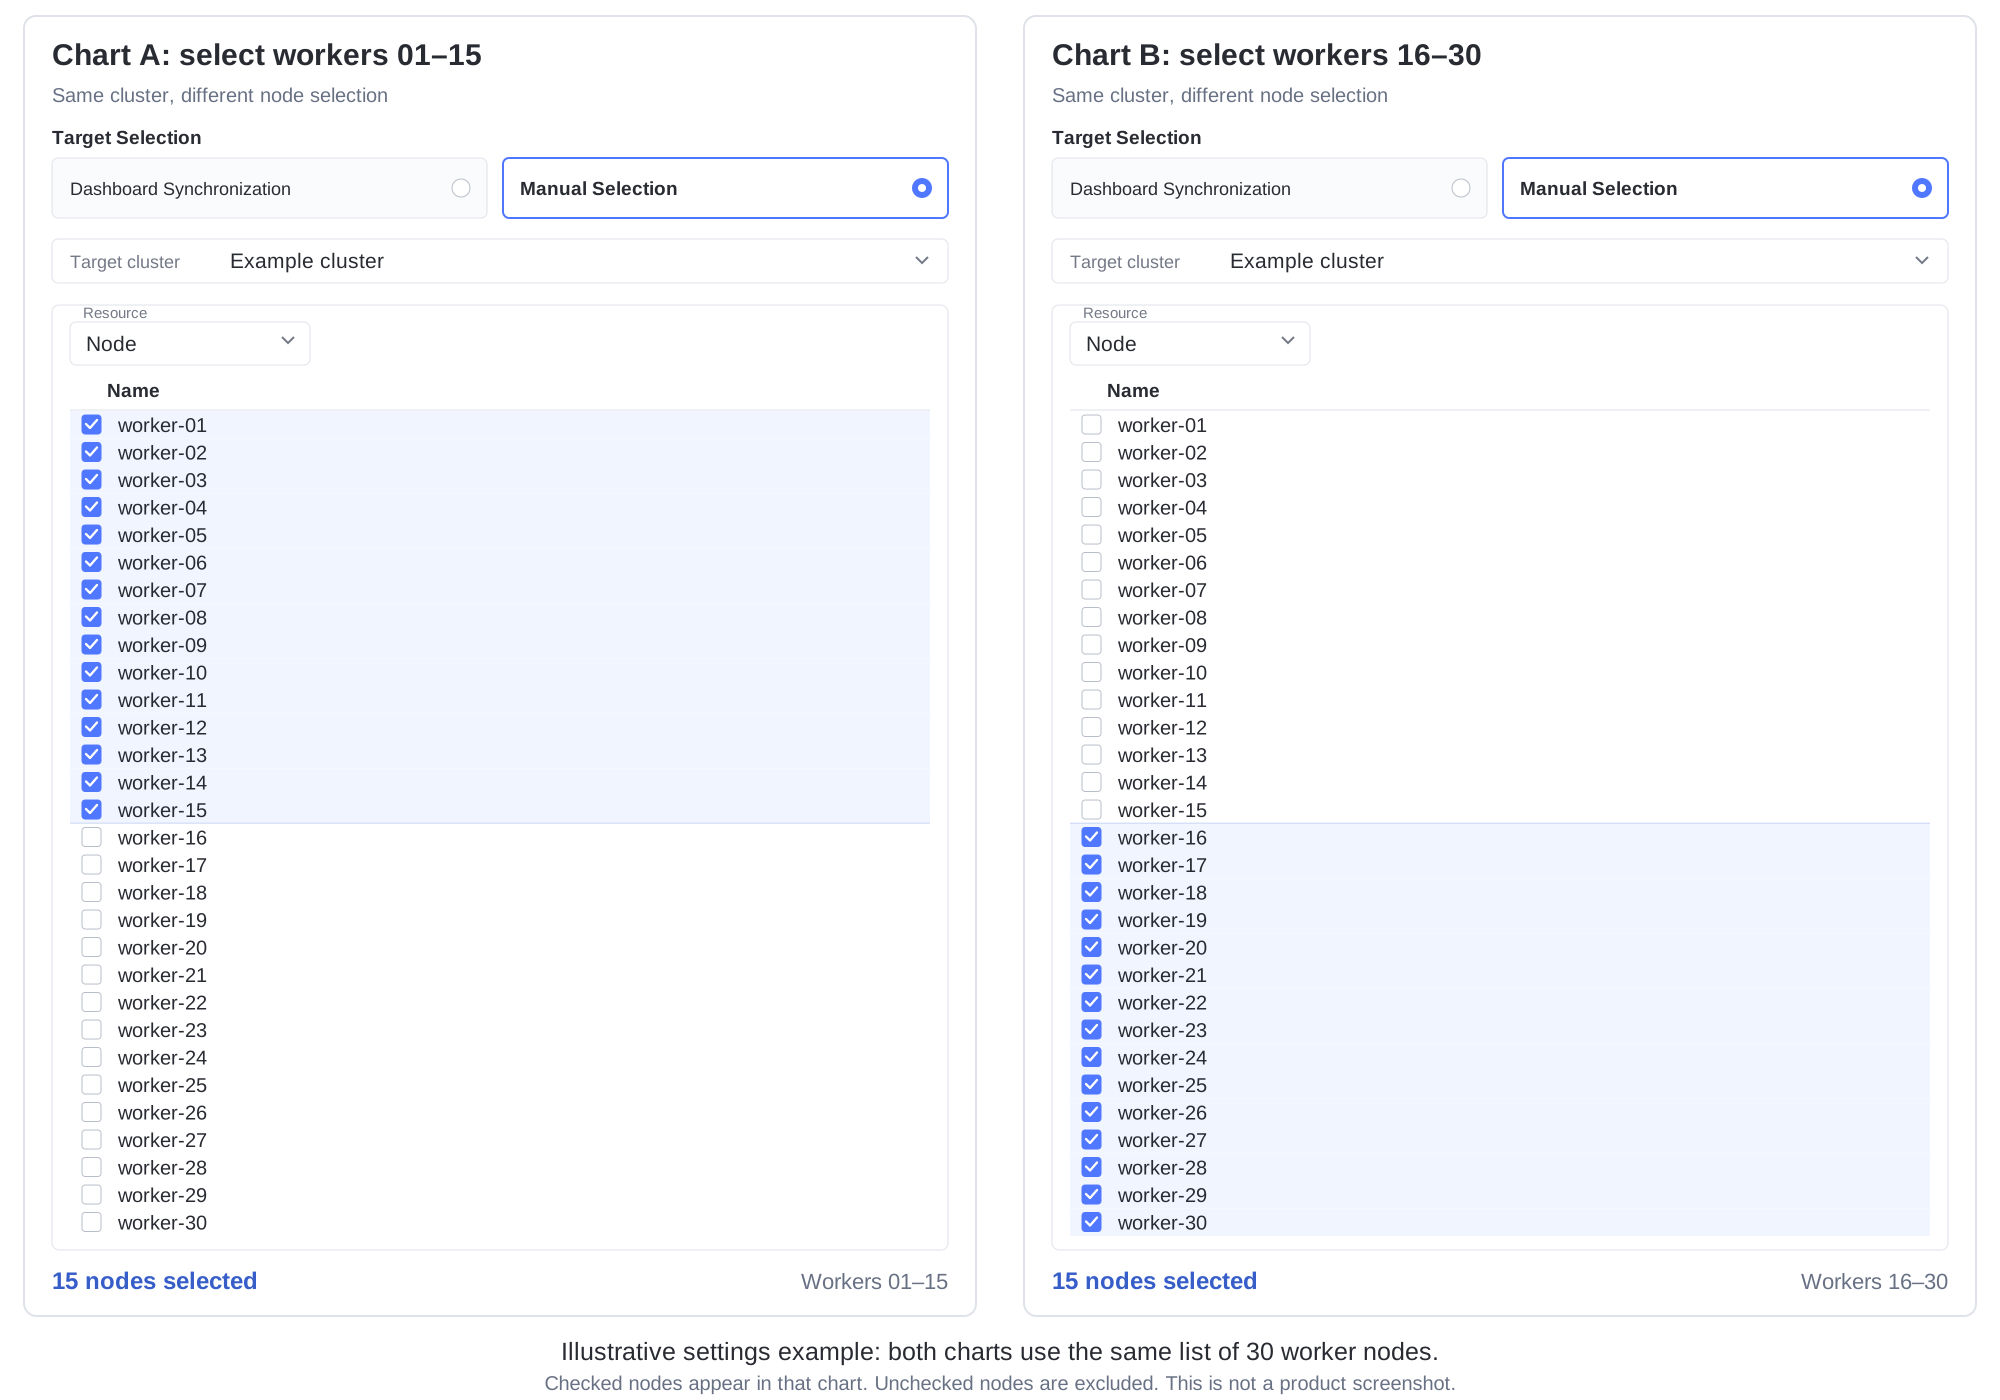
Use Manual Selection to choose each chart’s nodes.
Target Selection → Manual Selection
Target cluster → same cluster in both
Resource → Node
Settings illustration from the latest TechNote. Example node names; not a product screenshot.
MAP A · CHECK 01–15 Leave 16–30 unchecked.15 selected nodes
MAP B · CHECK 16–30 Leave 01–15 unchecked.15 selected nodes
3
Save both charts. Place them side by side, give them room, and save the dashboard.
Keep in mind: Manual Selection fixes each chart’s targets. Changing the dashboard’s cluster or namespace selectors won’t change those selections.
07 The dashboard we wanted
SamThere we go! All thirty nodes—and the pod detail we wanted.
JENNIFER KUBERNETESUser-defined dashboard
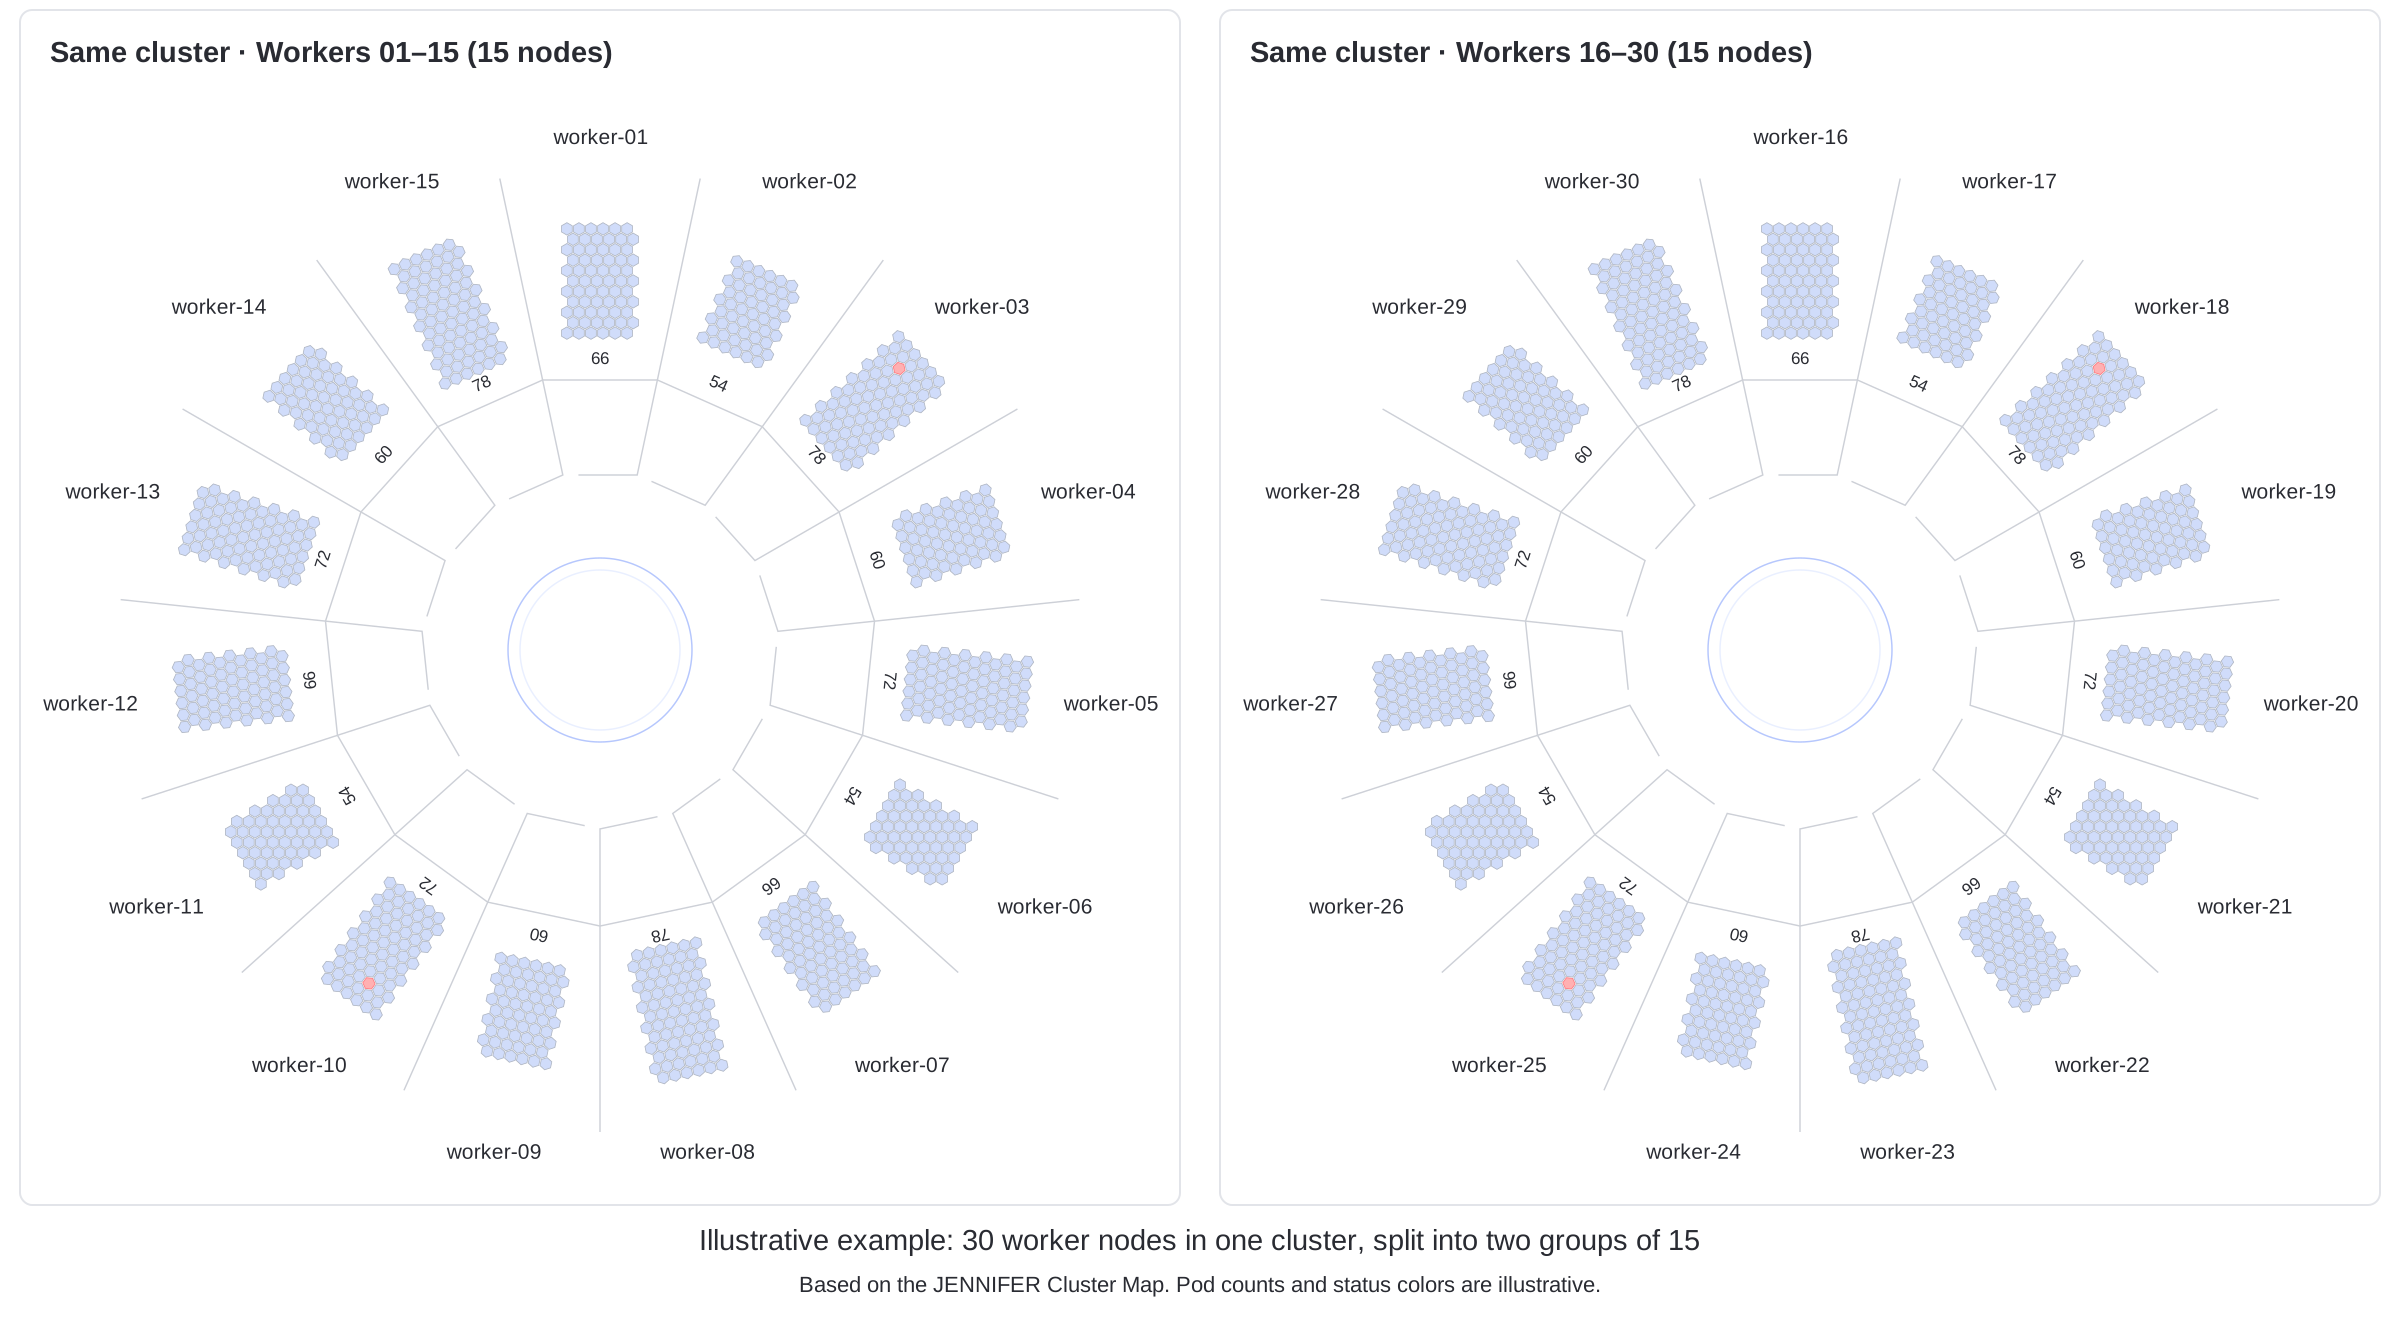
Same cluster · fifteen nodes per map
Detail and coverage.Individual pods are visible. All 30 worker nodes are covered.
JustinBoth maps, together on one dashboard. That’s what they needed.
Illustrative dashboard layout. Node names, pod counts and colors are examples.
08 Build the view around your team
DanaThat’s the idea. Build the dashboard around how your team works.
SamGot it. Our cluster. Our view.
One last check: keep the node selections up to date. After nodes are added or replaced, check for gaps and unintended duplicates.
Adapted from the final English TechNote, “Keeping the hexagonal pod view in larger JENNIFER clusters.” Customer dialogue is dramatized. Product illustrations and instructions follow the supplied TechNote.